
Nyheter
Europe’s defence awakening: strengthening security amid global shifts

The race to bolster European defence capabilities is well underway. Since the invasion of Ukraine, European leaders have intensified calls for increased defence spending. The continent, long reliant on US security guarantees, is now facing a critical inflection point. Recent moves by the US administration to engage with Russia without consulting its European allies or Ukraine have underscored the urgent need for Europe to take charge of its own defence. This geopolitical reality has forced European leaders to acknowledge that relying on US support is no longer a guaranteed strategy, accelerating discussions on independent military capabilities and funding mechanisms.
Why is European defence spending rising?
For decades, the US has outspent Europe on defence, contributing more than two-thirds of NATO’s[1] overall budget. However, NATO estimates that in 2024, 23 out of 32 members met the 2% GDP[2] defence spending target, compared to just seven members in 2022 and three in 2014[3]. More ambitious goals are being discussed. Poland is leading the way with a 4.12% of GDP defence budget, while discussions at NATO suggest some countries may need to increase spending to 3% or higher1.
Figure 1: NATO allies defence spending following Russia’s invasion of Ukraine
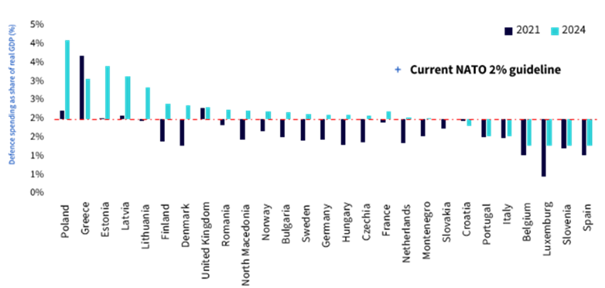
Source: Atlantic Council, WisdomTree. 2024 numbers are estimates. Iceland excluded as it does not have a standing army. Historical performance is not an indication of future performance and any investments may go down in value.
Adding another layer of complexity is the US Department of Government Efficiency (DOGE) initiative, which is beginning to reshape US defence priorities. The shift from cost-plus to fixed-price contracts under DOGE is putting financial pressure on defence companies most exposed to the US, which may see constraints on long-term spending commitments. This could have two contrasting effects: while it may limit US capability to fund European defence through NATO, it could also drive European nations to increase domestic procurement and reduce dependency on US defence systems.
Additionally, emerging security threats, including cyber warfare, artificial intelligence (AI)-driven military technology, and the growing presence of authoritarian regimes, have reinforced the need for increased defence investments. Europe’s reliance on outdated Cold War-era military equipment is another critical factor, pushing leaders to modernise their arsenals.
How will Europe fund its defence expansion?
Ramping up defence spending is a monumental task, especially given high sovereign debt levels across Europe. Yet, leaders are exploring creative solutions to secure the necessary funding. One approach is to reallocate existing European Union (EU) budgets, with discussions centring on repurposing unspent Cohesion Funds and Recovery and Resilience Facility (RRF) loans. However, legal restrictions within EU treaties may limit their direct application to military expenditures.
Another potential route is the issuance of European Defence Bonds, mirroring the successful NextGenerationEU pandemic recovery fund. By pooling resources at the EU level, this could offer a coordinated and cost-effective funding mechanism.
At the same time, private investment and public-private partnerships are gaining traction. Defence contractors and institutional investors are increasingly seen as strategic partners in financing large-scale projects, particularly in weapons systems, cyber defence, and artificial intelligence. Governments may leverage these collaborations to accelerate procurement and technological advancements.
Despite these options, one thing is clear—Europe must find a sustainable funding model to support its defence ambitions without derailing economic stability. Whether through EU-level financing, national budget reallocations, or private-sector involvement, securing long-term defence investment will be paramount in ensuring Europe’s security and strategic autonomy.
Impact on defence stocks: can the strong run continue?
European defence stocks have had a strong run since 2022, driven by surging order books, government contracts, and the realisation that military spending is no longer optional. Over the past year, Europe defence stocks rose 40.8%, outpacing broader European equities (+11.4%)[4]. Defence stocks trade at a historical P/E[5] ratio of ~14x, slightly above the long-term average, though still below peak multiples[6]
There are three key trends fuelling defence stock momentum:
• Backlogs at record highs: European defence contractors are sitting on unprecedented order books, with consensus forecasting 2024-29 CAGRs[7] of ~11% for sales and ~16% for both adjusted EBIT[8] and adjusted EPS[9]. These growth rates compare to just 8%, 11% and 12%, respectively, for the 2019-24 period[10].
Figure 2: European defence sector growth forecast
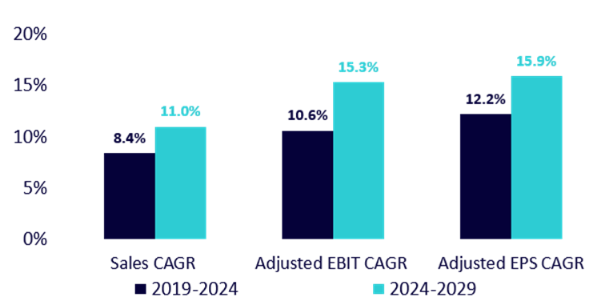
Source: Company Data, Visible Alpha Consensus, WisdomTree as of 31 January 2025. Forecasts are not an indicator of future performance and any investments are subject to risks and uncertainties.
• Government commitments: with long-term contracts locked in and additional spending likely, demand visibility remains strong.
• EU’s push for strategic autonomy: The European Commission has proposed a European Defence Industrial Strategy (EDIS), aimed at spending at least 50% of procurement budgets within the EU by 2030 and 60% by 2035[11].
Conclusion: a new era for European defence
The European defence sector is entering a new era of investment and strategic autonomy. With rising geopolitical risks and uncertainty over US support, European nations are taking proactive steps to build a more robust and self-sufficient military ecosystem. While funding challenges persist, the momentum behind higher budgets, technological investments, and NATO commitments makes this shift not just necessary, but inevitable.
With the EU backing structural shifts in procurement, defence stocks remain well-positioned, particularly those with exposure to land (for example, ammunition, vehicles) and air (for example, air defence, missiles, drones) domains.
Aneeka Gupta, Director, Macroeconomic Research, WisdomTree
This material is prepared by WisdomTree and its affiliates and is not intended to be relied upon as a forecast, research or investment advice, and is not a recommendation, offer or solicitation to buy or sell any securities or to adopt any investment strategy. The opinions expressed are as of the date of production and may change as subsequent conditions vary. The information and opinions contained in this material are derived from proprietary and non-proprietary sources. As such, no warranty of accuracy or reliability is given and no responsibility arising in any other way for errors and omissions (including responsibility to any person by reason of negligence) is accepted by WisdomTree, nor any affiliate, nor any of their officers, employees or agents. Reliance upon information in this material is at the sole discretion of the reader. Past performance is not a reliable indicator of future performance.
[1] NATO = The North Atlantic Treaty Organization (an intergovernmental transnational military alliance of 32 member states).
[2] GDP = gross domestic product.
[3] NATO 2023 Vilnius Summit Declaration.
[4] Bloomberg, Europe defence stocks are represented by the MSCI Europe Aerospace & Defence Index and European Equities represented by MSCI Europe Index.
[5] P/E = price-to-earnings.
[6] Bloomberg as of 31 January 2025.
[7] CAGR = compound annual growth rate.
[8] EBIT = earnings before interest and taxes.
[9] EPS = earnings per share.
[10] Company data, Visible Alpha Consensus, WisdomTree as of 31 January 2025.
[11] European Commission: Joint communication to the European Parliament, the Council as of August 2024.


Nyheter
BlackRock lanserar ST4R ETF för att erbjuda snabb tillgång till möjligheter inom rymdekonomin


Nya ETF- och ETP-noteringar den 9 juni 2026 på Deutsche Börse

UONS ETF spårar den amerikanska dagslåneräntan

BlackRock lanserar ST4R ETF för att erbjuda snabb tillgång till möjligheter inom rymdekonomin

DJIW ETF investerar i Sharia-kompatibla globala företag utanför USA

Nya ETF- och ETP-noteringar den 8 juni 2026 på Deutsche Börse

USA satsar 2 miljarder dollar på kvantdatorer – så kan investerare dra nytta av utvecklingen

De bästa ETFerna för att investera i emerging markets

Fastställd utdelning i MONTDIV maj 2026

Varför Plus500 är en dröm för finans-affiliate

Extrema skillnader: Varför presterar Europas kvantdator-ETFer så olika?
-
 Nyheter2 veckor sedan
USA satsar 2 miljarder dollar på kvantdatorer – så kan investerare dra nytta av utvecklingen
-
 Nyheter3 veckor sedan
De bästa ETFerna för att investera i emerging markets
-
 Nyheter3 veckor sedan
Fastställd utdelning i MONTDIV maj 2026
-
 Nyheter1 vecka sedan
Varför Plus500 är en dröm för finans-affiliate
-
 Nyheter1 vecka sedan
Extrema skillnader: Varför presterar Europas kvantdator-ETFer så olika?
-

 Nyheter3 veckor sedan
ASWF ETF är en aktivt förvaltad fond som investerar i Kanada
-

 Nyheter2 veckor sedan
21shares produkter nu finns tillgängliga hos Revolut
-

 Nyheter2 veckor sedan
Olja och Hormuzsundet fick flest sökningar i maj 2026