
Nyheter
ETC Group Crypto Market Compass #9 2024
• Last week, cryptoassets slightly underperformed traditional assets like equities although performance dispersion was very wide among individual cryptoassets
• Our in-house “Cryptoasset Sentiment Index” has continued to increase and still signals bullish sentiment – highest level since mid-December 2023
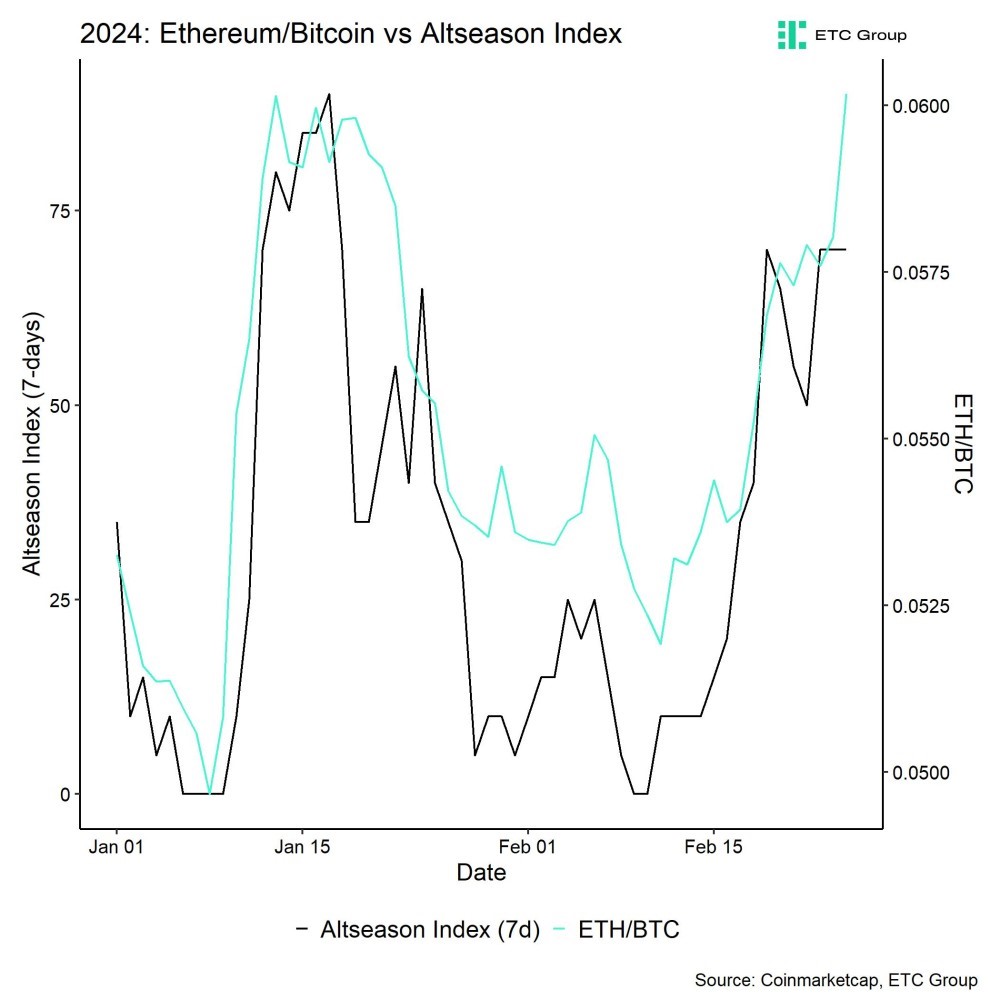
• Rising risk appetite in crypto markets is also visible in our “altseason index” which has increased in line with Ethereum’s outperformance against Bitcoin
Chart of the Week
Performance
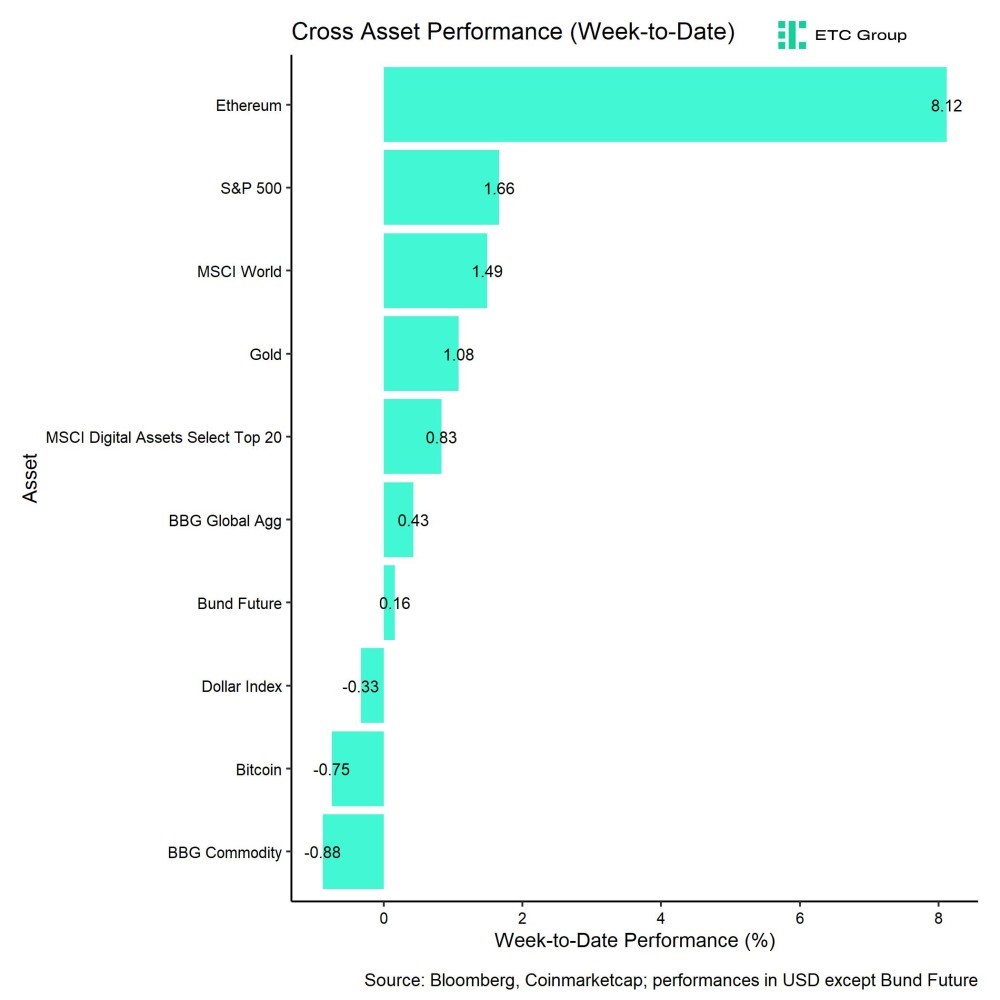
Last week, cryptoassets slightly underperformed traditional assets like equities although performance dispersion was very wide among individual cryptoassets.
While Bitcoin’s performance was rather flat last week, Ethereum managed to outperform Bitcoin by around 9%. Ethereum’s outperformance was generally a signal for a broader outperformance of so-called “altcoins” which represent all other cryptoassets apart from Bitcoin.
This is also visible in our “altseason index” which has increased in line with Ethereum’s outperformance against Bitcoin (Chart-of-the-Week). More specifically, 70% of cryptoassets within our basket of tracked altcoins managed to outperform Bitcoin over the past 7 days – the highest outperformance since early January.
Ethereum’s outperformance was also supported by improving network fundamentals relative Bitcoin and even relative to major ETH Layer 2s such as Polygon.
More specifically, While Ethereum’s network activity based on active addresses and transfer count managed to increase by around +1% year-to-date, Bitcoin’s network activity actually decreased by almost -20% this year, albeit from high levels.
In addition, there is increasing positive network momentum in ETH Layer 2s. For instance, following the token launch, StarkNet’s Total Value Locked (TVL) increased to 1.31 bn USD, making it the fourth Ethereum L2 to exceed 1 bn USD in TVL.
Apart from increasing activity in altcoins, we saw many regulatory news that were net bullish for the development of cryptoassets in the US.
For instance, former US president Donald Trump indicated during a recent TV interview that he is no longer anti-Bitcoin and said that he “can live with it”.
Although he has abstained from giving a clear endorsement for Bitcoin or cryptoassets in general, this statement marks a clear shift in tone by him. The latest nationwide opinion polls for the 2024 United States presidential election indicate that Trump could be the next US president.
Another big news from the European regulatory side was the communiqué by the Luxembourg financial regulator to allow investments by Luxembourg-domiciled funds into virtual assets such as Bitcoin. This implies that another wave of institutional money could soon flow into this asset class.
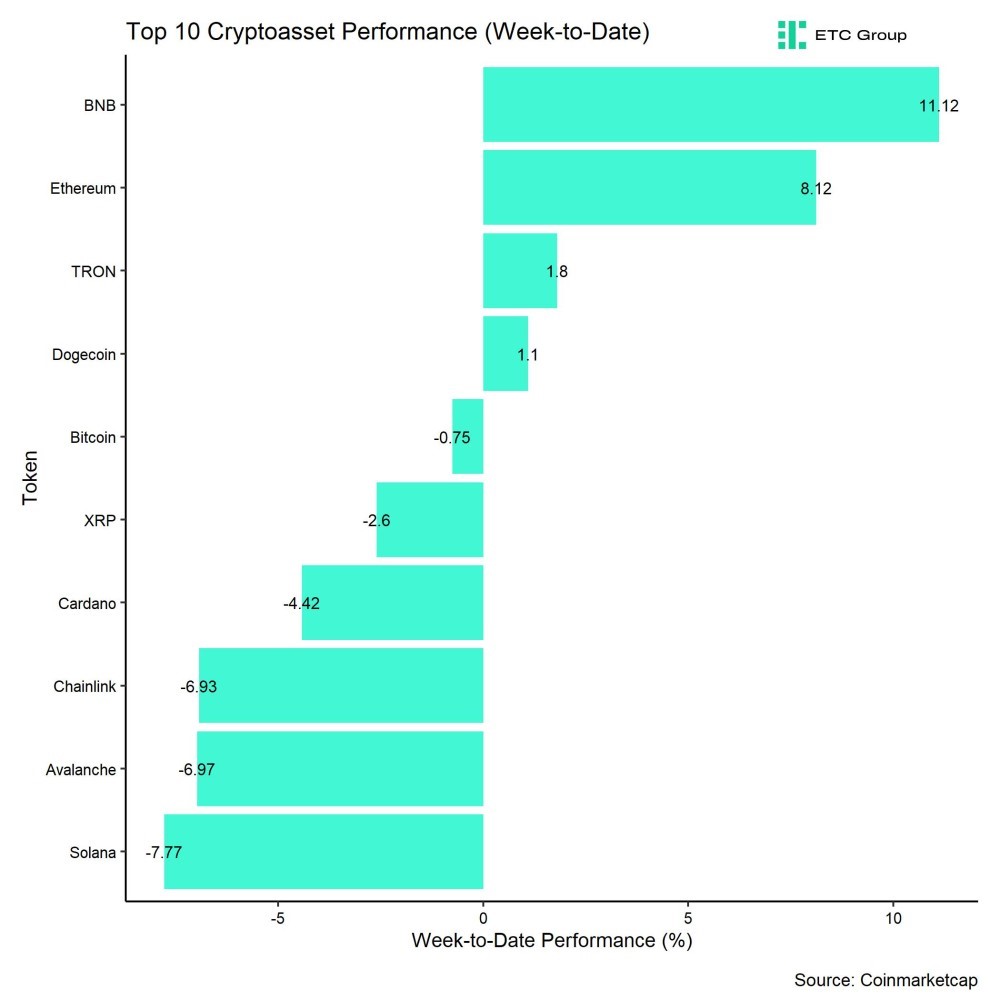
In general, among the top 10 crypto assets, Binance’s BNB token, Ethereum, and TRON were the relative outperformers.
As mentioned above, overall altcoin outperformance vis-à-vis Bitcoin also picked up compared to the week prior, with 70% of our tracked altcoins managing to outperform Bitcoin on a weekly basis.
Sentiment
Our in-house “Cryptoasset Sentiment Index” has also continued to increase and still signals bullish sentiment. In fact, the index increased to the highest level since mid-December 2023.
At the moment, 12 out of 15 indicators are above their short-term trend.
There are clear improvements in crypto dispersion visible which has contributed significantly to the latest upleg in the overall Cryptoasset Sentiment Index.
The Crypto Fear & Greed Index still remains in ”Greed” territory as of this morning.
Meanwhile, our own measure of Cross Asset Risk Appetite (CARA) mostly went sideways throughout the week but is still signalling a positive sentiment in traditional financial markets.
As mentioned above, performance dispersion among cryptoassets has increased significantly to the highest reading since November 2023.
In general, high performance dispersion among cryptoassets implies that correlations among cryptoassets are low, which means that cryptoassets are trading more on coin-specific factors and that cryptoassets are increasingly decoupling from the performance of Bitcoin.
At the same time, altcoin outperformance vis-à-vis Bitcoin has also increased, with a clear outperformance of Ethereum vis-à-vis Bitcoin last week. Viewed more broadly, around 70% of our tracked altcoins have outperformed Bitcoin on a weekly basis.
In general, increasing altcoin outperformance tends to be a sign of increasing risk appetite within cryptoasset markets.
Fund Flows
Overall, we saw another week of significant net fund inflows in the amount of +627.8 mn USD (week ending Friday) based on Bloomberg data across all types of cryptoassets.
However, the momentum of global fund flows has clearly decelerated from the very high levels we saw the week prior (above +2 bn USD).
Global Bitcoin ETPs continued to see significant net inflows of +569.8 mn USD of which +543.5 mn (net) were related to US spot Bitcoin ETFs alone. The ETC Group Physical Bitcoin ETP (BTCE) saw net outflows equivalent to -9.4 mn USD last week.
The Grayscale Bitcoin Trust (GBTC) continued to see net outflows of around -436.2 mn USD last week which was again lower as the week prior. This was also more than offset by net inflows into other US spot Bitcoin ETFs which managed to attract +1019 bn USD (ex GBTC).
Note that some fund flows data for US major issuers are still lacking in the abovementioned numbers due to T+2 settlement.
Apart from Bitcoin, we saw comparatively small flows into other cryptoassets last week again.
Inflows into global Ethereum ETPs continued to be relatively high last week with around +19.1 mn USD. The ETC Group Physical Ethereum ETP (ZETH) also attracted +1.3 mn USD in inflows. Besides, Altcoin ETPs ex Ethereum that managed to attract +21.9 mn USD last week which is a clear acceleration compared to prior weeks.
Thematic & basket crypto ETPs also experienced net inflows of +16.9 mn USD, based on our calculations. The ETC Group MSCI Digital Assets Select 20 ETP (DA20) also saw a slight pick-up in inflows last week. (+0.5 mn USD).
Besides, the beta of global crypto hedge funds to Bitcoin over the last 20 trading remained around 1.0 which implies that global crypto hedge funds are currently positioned neutral to Bitcoin market risks.
On-Chain Data
The shift in sentiment towards Ethereum and altcoins is generally also supported by improving network fundamentals relative to Bitcoin. But it is rather a weakness in Bitcoin than a strength in Ethereum’s general network activity.
More specifically, While Ethereum’s network activity based on active addresses and transfer count managed to increase by around +1% year-to-date, Bitcoin’s network activity actually decreased by almost -20% this year, albeit from high levels. This is mostly due to a decline in inscription transaction count more recently which has become a significant driver of Bitcoin’s on-chain activity.
Bitcoin’s decline in network activity is also visible in the general reduction in transaction fees that have declined to the lowest level since November 2023.
Apart from that, the development of exchange balances continue to be supportive of higher prices. BTC aggregate exchange balances have fallen to the lowest level since March 2018 and ETH exchange balances have fallen to the lowest level since July 2016. Decreasing on-exchange balances tend to be bullish for cryptoasset prices.
That being said, we did saw some increased BTC whale transfers from whales to exchanges but which were absorbed by demand from other entities. There is generally little BTC transfer volume to exchanges happening at the moment as the level of profit within wallets is relatively high. For instance, the Net Unrealized Profit/Loss metric (NUPL) is at 0.55 which implies that more than 50% of the current market cap of coins is in profit.
This means that less traders are willing to part with their bitcoins which implies low selling pressure on prices overall. This is usually also a necessary condition for a sustained bull market.
Another positive on-chain data point was the development of so-called accumulation wallet addresses. Bitcoin inflows into those accumulation addresses have reached an all-time high last week. Accumulation addresses are defined as addresses that have at least 2 incoming transfers and have never spent funds.
Futures, Options & Perpetuals
Aggregate BTC futures open interest has continued to move sideways over the past week. CME BTC futures open interest increased only slightly. BTC perpetual futures open interest has also moved sideways over the past week.
Besides, the 3-months annualized BTC futures basis continued to increase to around 16.1% p.a. which is the highest reading since early January.
BTC perpetual funding rate also remained relatively high indicating bullish sentiment on in BTC perpetual futures.
BTC options’ open interest also decreased last week by around -68k BTC due to the expiry on Friday. At the same time, the Put-call open increased throughout the week, implying that option traders continued to build up downside protections. Put-call volume ratios were also somewhat elevated.
The 25-delta BTC option skew for 1-month, 3-months, and 6-months expiries also increased last week, following the increase in 1-week skew observed the week prior. This increase in option skew also implies a relatively higher demand for put options.
In contrast, BTC option implied volatilities remained fairly unchanged compared to the week prior while the realized volatility of Bitcoin continued to drift lower on a 1-month rolling basis.
Bottom Line
• Last week, cryptoassets slightly underperformed traditional assets like equities although performance dispersion was very wide among individual cryptoassets
• Our in-house “Cryptoasset Sentiment Index” has continued to increase and still signals bullish sentiment – highest level since mid-December 2023
• Rising risk appetite in crypto markets is also visible in our “altseason index” which has increased in line with Ethereum’s outperformance against Bitcoin
Disclaimer
Important Information
The information provided in this material is for informative purposes only and does not constitute investment advice, a recommendation or solicitation to conclude a transaction. This document (which may be in the form of a blogpost, research article, marketing brochure, press release, social media post, blog post, broadcast communication or similar instrument – we refer to this category of communications generally as a “document” for purposes of this disclaimer) is issued by ETC Issuance GmbH (the “issuer”), a limited company incorporated under the laws of Germany, having its corporate domicile in Germany. This document has been prepared in accordance with applicable laws and regulations (including those relating to financial promotions). If you are considering investing in any securities issued by ETC Group, including any securities described in this document, you should check with your broker or bank that securities issued by ETC Group are available in your jurisdiction and suitable for your investment profile.
Exchange-traded commodities/cryptocurrencies, or ETPs, are a highly volatile asset and performance is unpredictable. Past performance is not a reliable indicator of future performance. The market price of ETPs will vary and they do not offer a fixed income. The value of any investment in ETPs may be affected by exchange rate and underlying price movements. This document may contain forward-looking statements including statements regarding ETC Group’s belief or current expectations with regards to the performance of certain asset classes. Forward-looking statements are subject to certain risks, uncertainties and assumptions, and there can be no assurance that such statements will be accurate and actual results could differ materially. Therefore, you must not place undue reliance on forward-looking statements. This document does not constitute investment advice nor an offer for sale nor a solicitation of an offer to buy any product or make any investment. An investment in an ETC that is linked to cryptocurrency, such as those offered by ETC Group, is dependent on the performance of the underlying cryptocurrency, less costs, but it is not expected to match that performance precisely. ETPs involve numerous risks including, among others, general market risks relating to underlying adverse price movements and currency, liquidity, operational, legal, and regulatory risks.


Even buying Bitcoin at its yearly peak since 2020 would still have doubled your investment, proving the power of long-term growth versus trying to time the market.


Why Solana matters: Exploring its use cases and growing adoption
Solana’s surge isn’t just market speculation; it’s driven by real-world adoption. From payments and DeFi to tokenization, the blockchain is seeing record engagement, reflected in its all-time high total value locked (TVL).


How Raydium and Jupiter are powering Solana DeFi
Raydium and Jupiter are the pillars of Solana’s DeFi ecosystem, delivering deep liquidity, seamless trading, and efficient execution that keep the network thriving. They make crypto markets faster, cheaper, and more accessible for everyone.


Research Newsletter
Each week the 21Shares Research team will publish our data-driven insights into the crypto asset world through this newsletter. Please direct any comments, questions, and words of feedback to research@21shares.com
Disclaimer
The information provided does not constitute a prospectus or other offering material and does not contain or constitute an offer to sell or a solicitation of any offer to buy securities in any jurisdiction. Some of the information published herein may contain forward-looking statements. Readers are cautioned that any such forward-looking statements are not guarantees of future performance and involve risks and uncertainties and that actual results may differ materially from those in the forward-looking statements as a result of various factors. The information contained herein may not be considered as economic, legal, tax or other advice and users are cautioned to base investment decisions or other decisions solely on the content hereof.


Time in Bitcoin beats timing Bitcoin

WMMV ETF en lågvolatilitetsfond som handlas i euro och pund
UBS AM lanserar UBS Treasury Yield Plus ETFer
COINUNI ETP spårar kryptovalutan Uniswap

ETF- och ETP-noteringar den 16 september 2025: nytt på Xetra och Börse Frankfurt

Utdelningar och försvarsfonder lockade i augusti

Månadsutdelande ETFer uppdaterad med IncomeShares produkter

HANetfs analyserar hur ett fredsavtal kan påverka det europeiska försvaret

ADLT ETF investerar bara i riktigt långa amerikanska statsobligationer

Septembers utdelning i XACT Norden Högutdelande
-
 Nyheter3 veckor sedan
Utdelningar och försvarsfonder lockade i augusti
-
 Nyheter4 veckor sedan
Månadsutdelande ETFer uppdaterad med IncomeShares produkter
-
 Nyheter4 veckor sedan
HANetfs analyserar hur ett fredsavtal kan påverka det europeiska försvaret
-
 Nyheter4 veckor sedan
ADLT ETF investerar bara i riktigt långa amerikanska statsobligationer
-
 Nyheter2 veckor sedan
Septembers utdelning i XACT Norden Högutdelande
-

 Nyheter3 veckor sedan
Fastställd utdelning i MONTDIV augusti 2025
-

 Nyheter2 veckor sedan
HANetf kommenterar mötet mellan Kina, Ryssland och Nordkorea vid militärparad
-

 Nyheter4 veckor sedan
AICT ETF investerar i obligationer utgivna av företag från tillväxtmarknader
Pingback: ETC Group Crypto Market Compass #9 2024 | Aktiegruvan