
Nyheter
Enter the dragon: Parsing Lunar New Year opportunities among emerging markets

As we enter the year of the dragon, Dina Ting, Head of Global Index Portfolio Management, assesses the opportunities and risks in China and Taiwan, which saw divergent market performance last year. She also highlights a region that not only has seen rising engagement with China but was also an EM bright spot that outperformed the S&P 500 Index in 2023—Latin America.
While Western season’s greetings are merry with wishes of joy, peace, love and blessings, those for Chinese cultures tend toward “good fortune.” In tandem with happiness for the Lunar New Year, wishes for prosperity are typical—and something that China investors could certainly use as we enter the year of the dragon.
China and Hong Kong markets had a humbling 2023 with equities down more than 10%. Fortunately, regulators in Beijing have turned up the dial on reform measures to stoke some of that auspicious dragon luck. Expectations are rising for even more support to come. In early February, China’s central bank made changes to allow its financial institutions to hold smaller cash reserves, cutting the reserve requirement ratio by 50 basis points. This is set to release nearly US$140 billion in long-term capital as Beijing seeks to boost targeted growth and market confidence.
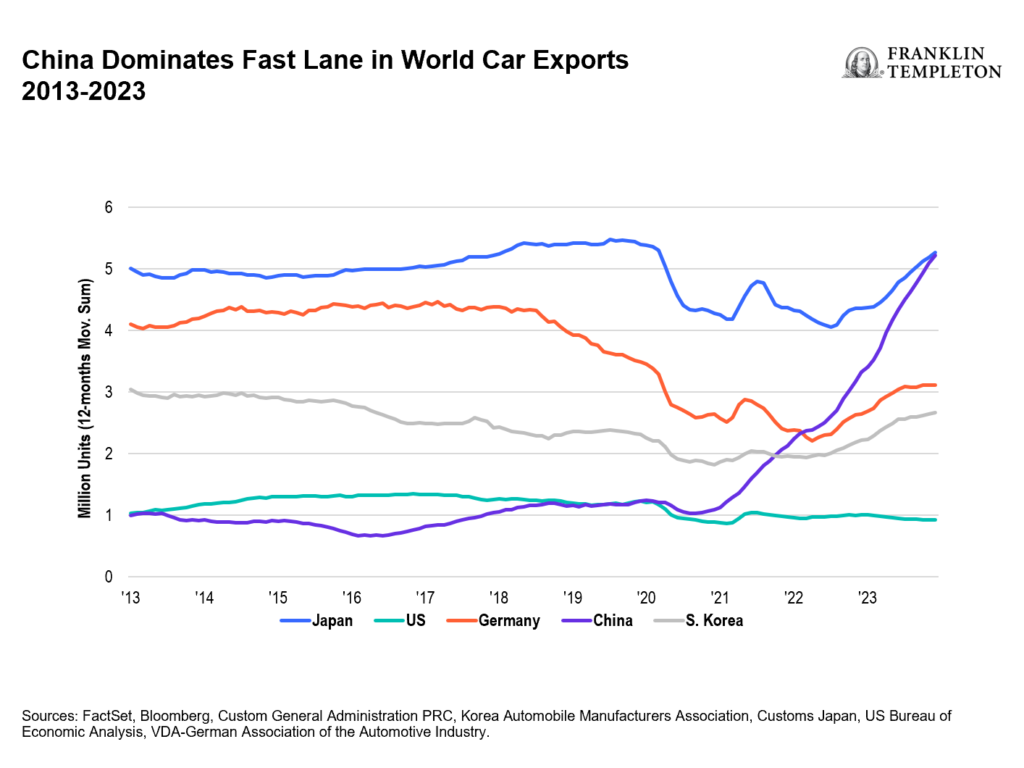
A rise in the country’s passenger vehicle sales also offers some hope, and 2023 saw China surpass Japan as the world’s largest car exporter.1 Year-over-year retail passenger car sales were up 57% in January, according to the China Passenger Car Association. The country’s expertise in so-called new-energy vehicles—fully electric and plug-in hybrids—is partly responsible for the export surge.2 Another important shift to note is that China’s auto industry is increasingly shipping to wealthier countries—exports to Australia tripled year-over-year during the first half of last year and sales to Spain rose 17-fold to nearly 70,000 vehicles.3 With renewed government support, China’s electric vehicle (EV) makers are making a big splash on the world stage. Shenzhen-based automaker BYD overtook Tesla as the world’s top seller of EVs at the end of 2023, and China’s overall passenger EV sales are forecast to make up 59% of world sales this year, compared to 50% in 2019.4
Still re-opening
Beijing has also begun stepping up tourism and travel promotions, granting visa-free entry to 11 countries, with Singapore and Thailand the latest to be included. Other policies to combat soft consumer demand include simplified visa procedures that allow travelers to apply for entry permits upon arrival at some ports and lower visa application fees for some foreign nationals.
In our view, Beijing’s recent spate of new reform policies should hold long-term benefits for its state-owned enterprises (SOEs), including its “big four” banks, as well as corporations entrenched in the country’s energy sector. Of course, China’s domestic deflationary pressures and real estate market weakness remain dominant concerns.
Beyond the Magnificent Seven (Mag7),5 which drove US equity returns last year, the broader equity market had less impressive returns over the same period. Big tech’s outperformance, coupled with sharp declines in China, may have also obscured some encouraging trends for emerging markets (EM), where we saw pockets of stellar performance. Understandably, global investors may feel inclined to await more regulatory clarity before warming to China’s markets. Keep in mind that a typical EM portfolio, such as the FTSE Emerging Index, holds about a 25% weighting in mainland China versus 18% for Taiwan.6 The MSCI AC Asia ex Japan Index holds a 29% exposure to China versus 19% for Taiwan.7 So for a more precise, targeted approach, investors may consider low-cost single country-focused exchange-traded funds to express tactical views.
2023 outperformers
Instead of “Mag7,” perhaps “Fantastic Four” can catch on as a moniker for four pockets within EM markets that outperformed the S&P 500 Index last year. They are Taiwan, Mexico, Brazil and Latin America, which predominantly consists of its two largest economies.
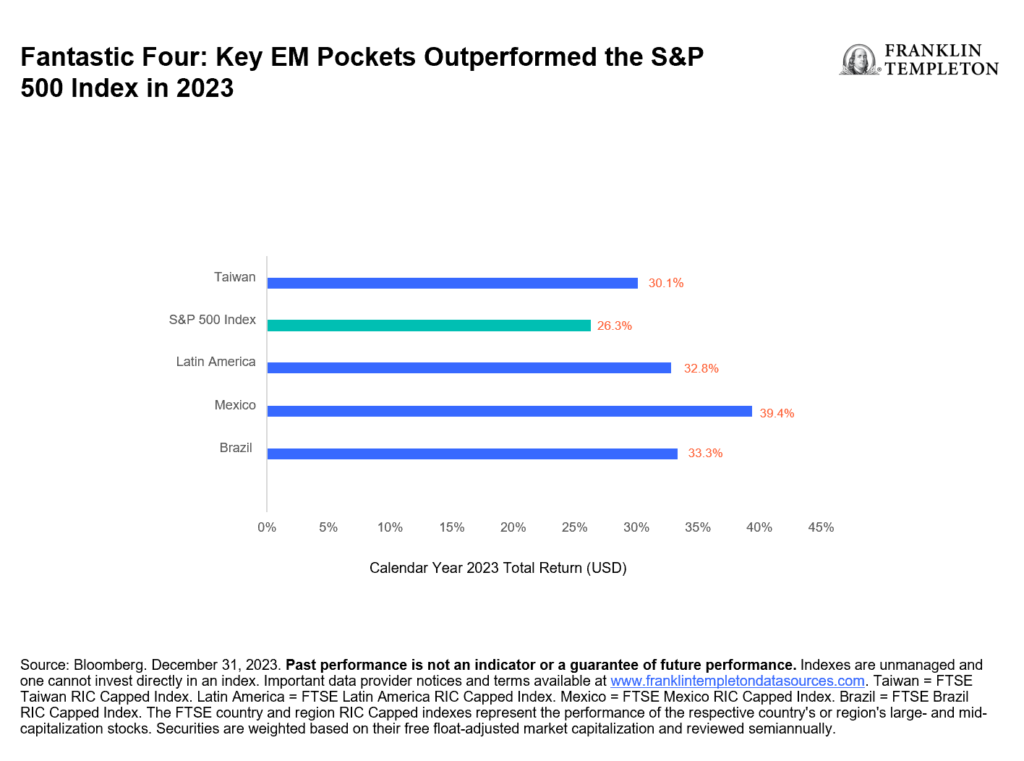
Excluding China, EM stocks (as measured by the MSCI Emerging Markets ex China Index) returned 20.1% in 2023,8 with Latin America (as measured by the FTSE Latin America RIC Capped Index) faring well, up 33% for the year.9 The equity markets of Mexico (39.4%, as measured by the FTSE Mexico RIC Capped Index) and Brazil (33.3%, as measured by the FTSE Brazil RIC Capped Index) were standouts, and in Asia, tech powerhouse Taiwan (30.1%, as measured by the FTSE Taiwan RIC Capped Index) also posted stellar performance.10 For investors wanting to capture both of Latin America’s largest economies, the FTSE Latin America RIC Capped Index has a combined weighting of more than 90% in Brazil and Mexico, and notably lacks exposure to Argentina. In recent years, China has cultivated a growing influence in Latin America with trade pacts, overseas foreign direct investment and loans playing a major role in its strengthened ties with the region. While India’s market slightly trailed the S&P 500 last year, it still exhibited robust growth and is increasingly seen as an appealing alternative to China among both businesses and investors.
When chips are down…
Looking ahead, analysts expect an ongoing resurgence in global semiconductor sales to continue boosting Taiwan’s market. Powered by artificial intelligence and 3D tech, the chips revenue comeback is forecast to see a low to mid-teens percentage increase this year.11 Furthermore, to meet growing demand in key markets, Taiwan’s most valuable chip giant plans to expand its global footprint. In collaboration with Sony and Toyota, Taiwan Semiconductor Manufacturing has new plans to build a second plant in Japan.
In January, Taiwan saw its overall exports expand for a third consecutive month with an 18% year-over-year rise.12 During the month, the ruling Democratic Progressive Party’s (DPP) retention of the presidency in Taiwan’s recent elections appeared to support continuity in its economic policy. Although cross-straits relations continue to pose risks, markets had largely factored in the pro-independent DPP’s narrow victory.
- Source: “China Overtakes Japan As World’s Biggest Vehicle Exporter.” Barron’s. January 31, 2024.
- Sources: Xinhua news agency, China Passenger Car Association.
- Source: “How China became a car-exporting juggernaut.” The Economist. August 10, 2023,
- Source: BloombergNEF.
- The Magnificent Seven are (Mag7) Apple, Amazon, Alphabet, Meta, Microsoft, Nvidia and Tesla.
- Source: FTSE Russell, February 13, 2024. The FTSE Emerging Index provides investors with a comprehensive means of measuring the performance of the most liquid large- and mid-cap companies in the emerging markets. Indexes are unmanaged and one cannot invest directly in an index. Important data provider notices and terms available at www.franklintempletondatasources.com.
- Source: MSCI, January 31, 2024. The MSCI AC Asia ex Japan Index captures large- and mid-cap representation across two of three developed market countries (excluding Japan) and eight emerging market countries in Asia. Indexes are unmanaged and one cannot invest directly in an index. Important data provider notices and terms available at www.franklintempletondatasources.com.
- Source: Bloomberg, as of December 31, 2023. The MSCI Emerging Markets ex China Index captures large- and mid-cap representation across 23 of the 24 emerging market countries excluding China. Past performance is not an indicator or a guarantee of future performance. Indexes are unmanaged and one cannot invest directly in an index. Important data provider notices and terms available at www.franklintempletondatasources.com.
- Source: Bloomberg, as of December 31, 2023. The FTSE country and region RIC Capped indexes represent the performance of the respective country’s or region’s large- and mid-capitalization stocks. Securities are weighted based on their free float-adjusted market capitalization and reviewed semiannually. Past performance is not an indicator or a guarantee of future performance. Indexes are unmanaged and one cannot invest directly in an index. Important data provider notices and terms available at www.franklintempletondatasources.com.
- Ibid.
- Sources: Deloitte, Semiconductor Industry Association, Gartner, Inc.
- Source: Ministry of Finance, Republic of China, February 2024.

This message may contain information that is legally privileged or confidential. If you received this transmission in error, please notify the sender by reply email, and delete the message and any attachments. This transmission is believed to be defect free; however, no responsibility is accepted by the sender for damage arising from its receipt.
All email and instant messages (including attachments) sent to or from Franklin Templeton (FT) personnel may be retained, monitored and/or reviewed by FT and its agents, or other authorized parties as disclosed in FT’s Privacy Notice, without further notice or consent. Refer to our country/region specific Privacy & Cookies Notice, which you can read here or access directly at: http://www.franklintempletonglobal.com/privacy to learn more. Depending on your location, other privacy laws and regulations may also apply to you.


JOGS ETF investerar aktivt i small caps från hela världen

Nya ETF- och ETP-noteringar den 10 juni 2026 på Deutsche Börse

A1P0 ETF ger riktad exponering mot nästa generations artificiell intelligens
Interactive Brokers lanserar provisionsfria iShares ETFer från BlackRock genom Recurring Investment-funktionen i hela Europa

Nya ETF- och ETP-noteringar den 9 juni 2026 på Deutsche Börse

USA satsar 2 miljarder dollar på kvantdatorer – så kan investerare dra nytta av utvecklingen

De bästa ETFerna för att investera i emerging markets

Fastställd utdelning i MONTDIV maj 2026

Varför Plus500 är en dröm för finans-affiliate

Extrema skillnader: Varför presterar Europas kvantdator-ETFer så olika?
-
 Nyheter2 veckor sedan
USA satsar 2 miljarder dollar på kvantdatorer – så kan investerare dra nytta av utvecklingen
-
 Nyheter3 veckor sedan
De bästa ETFerna för att investera i emerging markets
-
 Nyheter3 veckor sedan
Fastställd utdelning i MONTDIV maj 2026
-
 Nyheter1 vecka sedan
Varför Plus500 är en dröm för finans-affiliate
-
 Nyheter1 vecka sedan
Extrema skillnader: Varför presterar Europas kvantdator-ETFer så olika?
-

 Nyheter3 veckor sedan
ASWF ETF är en aktivt förvaltad fond som investerar i Kanada
-

 Nyheter2 veckor sedan
21shares produkter nu finns tillgängliga hos Revolut
-

 Nyheter2 veckor sedan
Olja och Hormuzsundet fick flest sökningar i maj 2026