
Nyheter
ETC Group Crypto Market Compass #35 2024

• Last week, cryptoassets were supported by clear signals for a pivot in Fed monetary policy following dovish remarks by Fed chairman Powell at the recent central bank symposium in Jackson Hole.
• Our in-house “Cryptoasset Sentiment Index” signals a neutral sentiment at the moment.
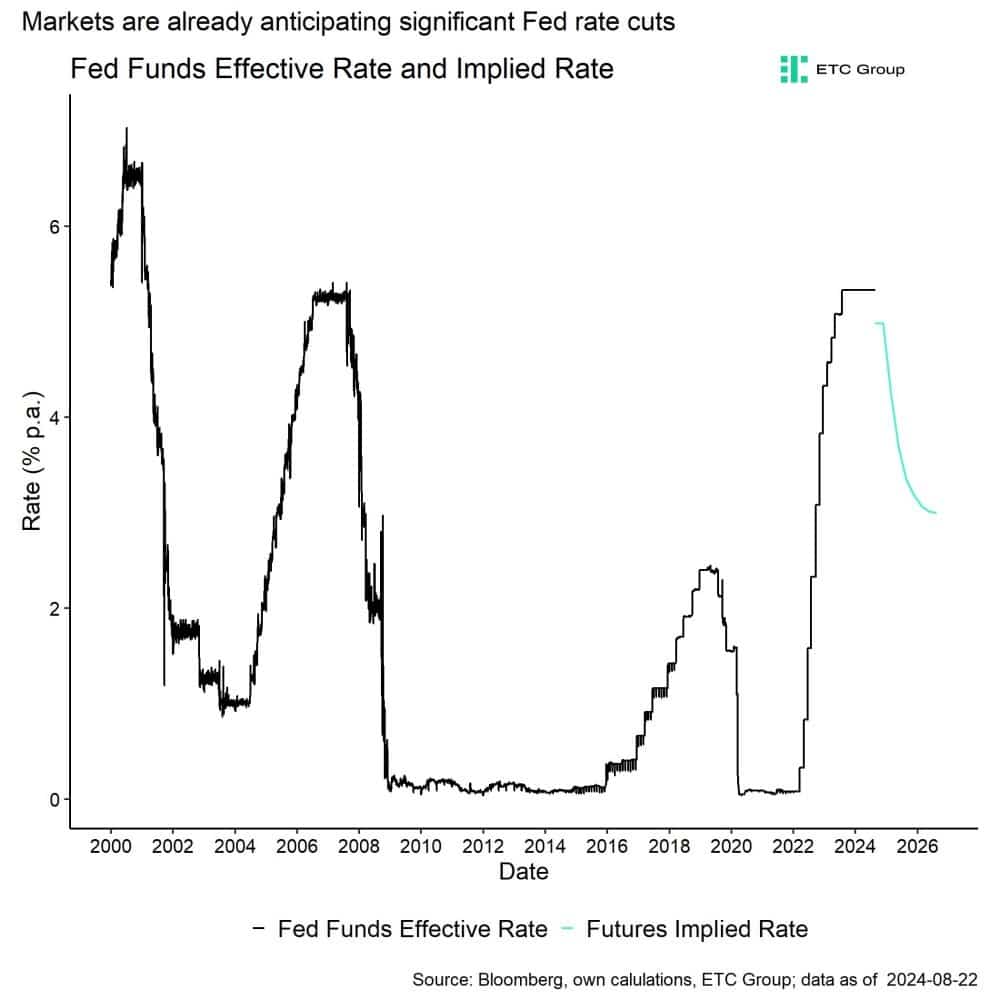
• Fed Funds Futures already price in slightly more than 9 cuts à 25 bps each and a terminal rate of 3% which will be reached by the end of 2025, ie markets are already anticipating significant cuts to the Fed Funds target rate.
Editorial Note: ETC Group has been acquired by Bitwise Asset Management as of the 16th of August 2024. Find out more here.
Chart of the Week
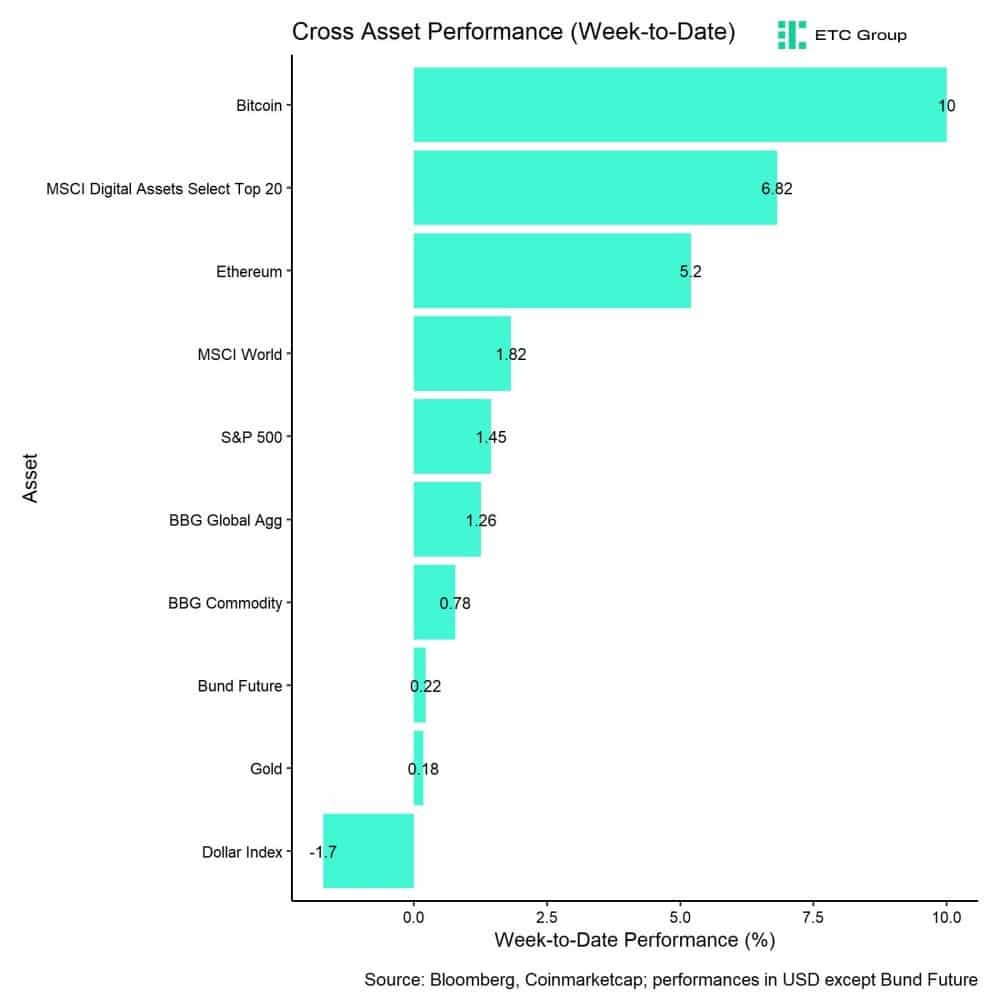
Performance
Last week, cryptoassets were supported by clear signals for a pivot in Fed monetary policy following dovish remarks by Fed chairman Powell at the recent central bank symposium in Jackson Hole.
Powell’s comments were dovish across the board and essentially signalled that the Fed can no longer tolerate a deterioration in labour market conditions in favour of maintain price stability, ie lowering inflation. More specifically, the following remarks by Powell were interpreted by markets as a clear signal towards an imminent shift in monetary policy and rate cuts in September:
“The time has come for policy to adjust. The direction of travel is clear, and the timing and pace of rate cuts will depend on incoming data, the evolving outlook, and the balance of risks.”
Powell’s remarks essentially confirmed what Fed Funds Futures markets have already been anticipating following the capitulation event in early August 2024 – initial rate cuts starting in September. The latest payroll benchmark downward revisions which suggested that past payroll growth was much lower than previously estimated, made the case for rate cuts in September even stronger.
At the time of writing, Fed Funds Futures already price in slightly more than 9 cuts à 25 bps each and a terminal rate of 3% which will be reached by the end of 2025. So, markets are already anticipating significant cuts to the Fed Funds target rate (Chart-of-the-Week).
The big question is whether Fed interest rate cuts could 1. be faster than anticipated, and 2. deeper than anticipated amid an increasingly likely US recession over the coming months?
Only in this kind of scenario, Fed cuts could continue to remain a significant tailwind for markets.
The Fed is essentially following the footsteps of other major central banks such as the ECB or Bank of England that have already commenced their interest rate cutting cycle.
In this context, it is important to highlight that global money supply has recently reached a new all-time high already. Historically speaking, periods of global money supply expansion tend to be bullish for Bitcoin and cryptoassets.
Another important development was the withdrawal of RFK Jr. from the US presidential elections and his personal endorsement of Donald Trump. This has increased the odds of Trump winning the presidency which is generally regarded as a net positive outcome for crypto markets.
However, at the time of writing, betting markets still see Harris in the lead with 50.4% against 47.8% for Trump according to electionbettingodds.com which aggregates betting odds across different providers.
Last week’s recovery in crypto markets was also supported by an acceleration in net inflows into global crypto ETPs that attracted almost 700 mn USD.
However, there was a large divergence between Bitcoin and Ethereum ETP flows which led to a significant underperformance of Ethereum vis-à-vis Bitcoin last week. Risk appetite in altcoins was also somewhat muted due to the arrest of Telegram’s founder Pavel Durov in Paris over the weekend, which led to a strong underperformance of Telegram’s Open Network token TON.
That being said, overall altcoin outperformance vis-à-vis Bitcoin remained relatively resilient despite the abovementioned market developments.
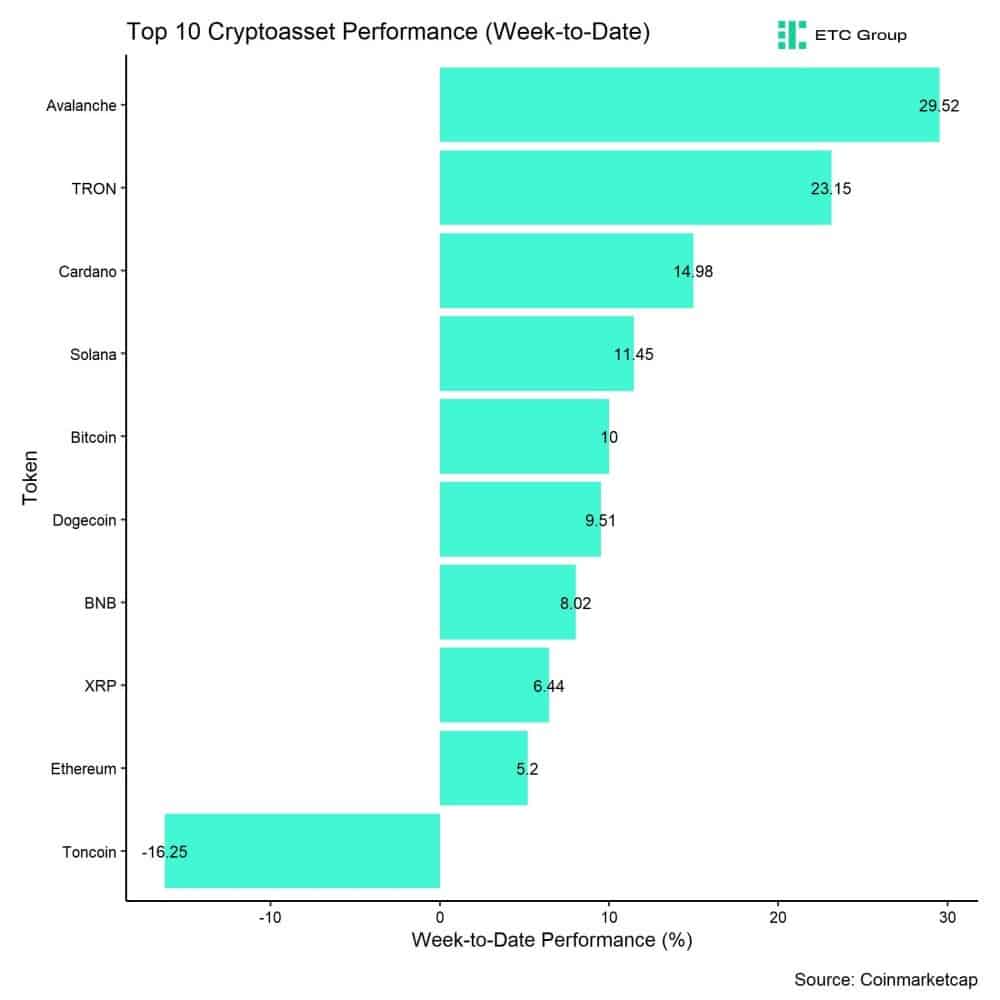
In general, among the top 10 crypto assets, Avalanche, TRON, and Cardano were the relative outperformers.
Overall, altcoin outperformance vis-à-vis Bitcoin remained resilient lately, with 70% of our tracked altcoins managing to outperform Bitcoin on a weekly basis, despite a significant underperformance of Ethereum relative to Bitcoin.
Sentiment
Our in-house “Cryptoasset Sentiment Index” signals a neutral level of sentiment at the moment.
At the moment, 10 out of 15 indicators are above their short-term trend.
Last week, there were significant reversals to the upside in the Altseason index and Crypto Fear & Greed Index.
The Crypto Fear & Greed Index currently signals a “Greed” level of sentiment as of this morning.
Performance dispersion among cryptoassets still remains at low levels. This means that altcoins are still very much correlated with the performance of Bitcoin.
Altcoin outperformance vis-à-vis Bitcoin continued to stay high, with 70% of our tracked altcoins outperforming Bitcoin on a weekly basis. However, Ethereum significantly underperformed Bitcoin last week.
In general, increasing (decreasing) altcoin outperformance tends to be a sign of increasing (decreasing) risk appetite within cryptoasset markets and the latest altcoin outperformance signals increasing appetite for risk at the moment.
Meanwhile, sentiment in traditional financial markets as measured by our in-house measure of Cross Asset Risk Appetite (CARA) remains at neutral levels after having recovered sharply from the very low levels observed in early August.
Fund Flows
Fund flows into global crypto ETPs accelerated significantly last week.
Global crypto ETPs saw around +688.5 mn USD in net inflows across all types of cryptoassets which is a significant reversal from the -4.2 mn USD in outflows observed the week prior.
Global Bitcoin ETPs saw significant net inflows of +661.8 mn USD last week, of which +437.3 mn USD in net inflows were related to US spot Bitcoin ETFs alone.
Last week also saw a positive reversal in flows into Hong Kong Bitcoin ETFs with +132.4 mn USD in net inflows.
Outflows from the ETC Group Physical Bitcoin ETP (BTCE) decelerated somewhat last week with net outflows equivalent to -12.5 mn USD and the ETC Group Core Bitcoin ETP (BTC1) also saw minor negative net outflows of -0.8 mn USD.
The Grayscale Bitcoin Trust (GBTC) continued to see net outflows, with around -86.5 mn USD last week.
Meanwhile, global Ethereum ETPs continued to see net outflows last week of -21.0 mn USD. US Ethereum spot ETFs saw around -44.5 mn USD in net outflows in aggregate. However, this was mostly related to continuing outflows from the Grayscale Ethereum Trust (ETHE) which experienced -118 mn USD in net outflows last week while all other US products have seen +74 mn USD in net inflows.
Hong Kong Ethereum ETFs saw sticky AuM last week (+/- 0 mn USD).
The ETC Group Physical Ethereum ETP (ZETH) saw minor net outflows last week (-0.8 mn USD) while the ETC Group Ethereum Staking ETP (ET32) showed flat AuM last week (+/- 0 mn USD).
In contrast, Altcoin ETPs ex Ethereum experienced positive net flows of around +11.7 mn USD last week.
Besides, Thematic & basket crypto ETPs also saw continued net inflows with around +36.0 mn USD last week. The ETC Group MSCI Digital Assets Select 20 ETP (DA20) saw neither in- nor outflows last week (+/- 0 mn USD).
Meanwhile, global crypto hedge funds increased their market exposure last week to a 3-months high but still remain slightly underweight to Bitcoin. The 20-days rolling beta of global crypto hedge funds’ performance to Bitcoin increased to around 0.92 per yesterday’s close.
On-Chain Data
In general, on-chain metrics imply a strong improvement in relative buying power.
For instance, Bitcoin spot intraday net buying volumes have significantly reversed to the upside. Over the past week, net buying volumes across BTC spot exchanges amounted to around +546 mn USD. They reached a 3-months high on Friday last week due to the acceleration in US spot Bitcoin ETF inflows.
Meanwhile, BTC whales mostly remained on the sidelines. More specifically, BTC whales have transferred around 1.1k BTC off exchange. Whales are defined as network entities that control at least 1,000 BTC. As a result, on-exchange balances have declined over the past week.
It is interesting to highlight that buyers were able to absorb the increasing supply that emanated from continued distribution of bitcoins by the Mt Gox trustee last week who distributed around 1.3k BTC via Bitstamp according to data by Arkham.
Another important market development to highlight was the fee spike on the Bitcoin core network on the 22nd of August as traders rushed to Babylon Labs’ new Bitcoin staking protocol. The staking amount was capped at 1k BTC which is why traders rushed to stake and were willing to pay high transaction fees. As a result, average transaction fees reached 7.2 USD per transaction on the 22nd of August but have now normalised again (0.64 USD per transaction now) according to data provided by Glassnode.
As far as Ethereum is concerned, market sentiment was somewhat burdened by the fact that the Ethereum Foundation distributed around 35k ETH via Kraken and Binance which also contributed to the recent underperformance of Ethereum vis-à-vis Bitcoin.
That being said, overall ETH exchange balances continued to drift lower last week and reached a new multi-year low which still signals an increasing supply deficit for Ethereum.
What is more is that on-chain activity on Ethereum layer 2s such as Base continues to improve significantly. Active addresses on Base have recently surpassed 1 million.
Futures, Options & Perpetuals
Last week, derivatives traders continued to increase their exposure to BTC via futures and perpetuals. More specifically, BTC futures open interest increased by +20k BTC and BTC perpetual open interest increased by +12k BTC.
This happened amid a general ascend in prices which suggests that this increase in open interest was probably related to long open interest. Short liquidations of BTC futures also increased somewhat as bitcoin decisively crossed 60k USD again but remained relatively low compared to the amount of liquidations we saw at the beginning of August.
BTC perpetual funding rates also increased after having remained much of the past week in negative territory.
When the funding rate is positive (negative), long (short) positions periodically pay short (long) positions. A positive funding rate tends to be a sign of bullish sentiment in perpetual futures markets.
The 3-months annualized BTC futures basis rate remained relatively flat compared to the week prior at around 8.7% p.a.
Besides, BTC option open interest increased significantly by around +16k BTC. The significant decline in put-call open interest ratio suggests a net increase in call demand relative puts which is a bullish sign.
was mostly flat last week while the slight decline in put-call open interest ratio suggests a slight net increase in call demand relative puts. The 1-month 25-delta skews for BTC also declined and turned negative suggesting increasing relative demand for call options.
Meanwhile, BTC option implied volatilities mostly went sideways. At the time of writing, implied volatilities of 1-month ATM Bitcoin options are currently at around 51.8% p.a.
Besides, there was a significant development in Ethereum derivatives as well. ETH futures traders apparently piled into short contracts as the 1-month forward contract premium to spot prices on CME Ethereum futures reached the lowest level since December 2022.
This is also consistent with the observation that leveraged funds’ net positioning in Ethereum futures on CME continued to stay near record low levels. At the time of writing, leveraged funds are -30656 contracts net short in Ethereum futures.
These derivative market developments have also likely contributed to the recent underperformance of Ethereum vis-à-vis Bitcoin.
Bottom Line
• Last week, cryptoassets were supported by clear signals for a pivot in Fed monetary policy following dovish remarks by Fed chairman Powell at the recent central bank symposium in Jackson Hole.
• Our in-house “Cryptoasset Sentiment Index” signals a neutral sentiment at the moment.
• Fed Funds Futures already price in slightly more than 9 cuts à 25 bps each and a terminal rate of 3% which will be reached by the end of 2025, ie markets are already anticipating significant cuts to the Fed Funds target rate.
Read the full report including the Cryptoasset Sentiment Index and full chart show in the appendix on our website.

This is not investment advice. Capital at risk. Read the full disclaimer
© ETC Group 2019-2024 | All rights reserved


Noteringar av ETF och ETP på Xetra den 17 juli 2025

XCSI ETF en swapbaserad fond som spårar 500 kinesiska småbolagsaktier

En jämförelse av olika Halal ETFer

Valour XAUT SEK en digital tillgång uppbackad av fysiskt guld

Don’t miss this: 2025’s Mid-Year State of Crypto is Here

De bästa ETFer som investerar i europeiska utdelningsaktier

Nordea Asset Management lanserar nya ETFer på Xetra

Svenska investerare — 21Shares Nasdaq Stockholm-sortiment har just blivit starkare

Hetaste investeringstemat i juni 2025

De bästa ETFerna med fokus på momentum
-
 Nyheter4 veckor sedan
De bästa ETFer som investerar i europeiska utdelningsaktier
-
 Nyheter4 veckor sedan
Nordea Asset Management lanserar nya ETFer på Xetra
-
 Nyheter4 veckor sedan
Svenska investerare — 21Shares Nasdaq Stockholm-sortiment har just blivit starkare
-
 Nyheter3 veckor sedan
Hetaste investeringstemat i juni 2025
-
 Nyheter3 veckor sedan
De bästa ETFerna med fokus på momentum
-
 Nyheter3 veckor sedan
12 000 artiklar om börshandlade fonder
-

 Nyheter3 veckor sedan
Primer: Injective, infrastructure for global finance
-

 Nyheter2 veckor sedan
REX Shares lanserar tre nya covered call ETFer i Europa