
Nyheter
ETC Group Crypto Market Compass #25 2024
• Last week, cryptoassets underperformed traditional assets as risks to global growth are increasing
• Our in-house “Cryptoasset Sentiment Indicator” continues to fluctuate around neutral levels of sentiment
• Global growth expectations as priced by traditional financial markets have plunged to the lowest level since March 2023 which has negatively affected Cryptoasset Sentiment as well
Chart of the Week
Performance

Last week, cryptoassets underperformed traditional assets such as equities and bonds as risks to global growth are increasing.
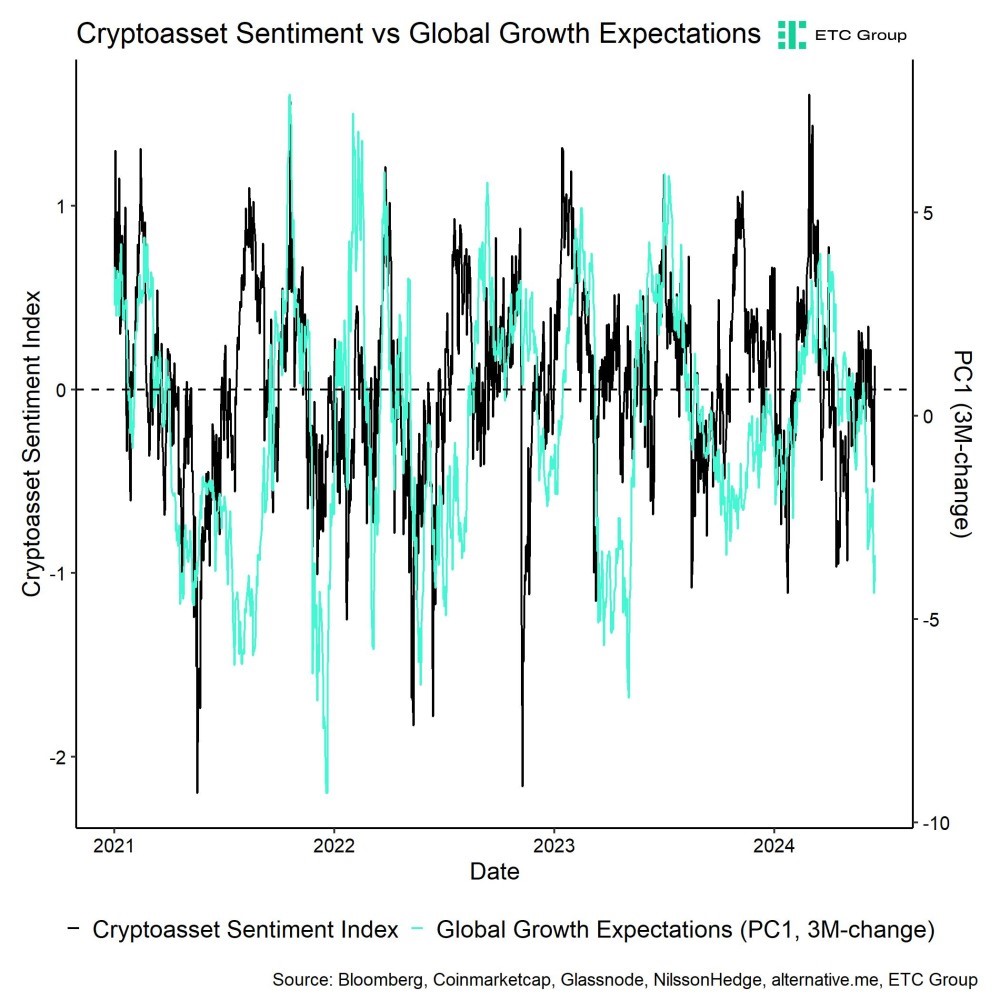
In fact, global growth expectations as priced by traditional financial markets have plunged to the lowest level since March 2023 when Silicon Valley Bank collapsed. This has affected overall Cryptoasset Sentiment negatively as well (Chart-of-the-Week). This was accompanied by persistent net outflows from global crypto ETPs as well.
Nonetheless, major US equity indices continued to rallye to new all-time highs although the outperformance of both Bunds and gold vis-à-vis equities hints at some safe-haven demand.
One of the major reasons why global growth expectations are being revised downwards is the fact that US economic data have continued to underwhelm consensus expectations. The Bloomberg US ECO Surprise Index, which measures how important macro data releases have over- or underwhelmed expectations, has decreased to the lowest level since 2019. It appears as if the market is generally catching up to this worsening macro environment.
Although major equity benchmark indices like the S&P 500 have not shown any weakness, cyclical macro trades such as the AUD/JPY exchange rate, US cyclicals/defensives stock sectors, copper/gold are already signalling that the outlook for global growth is weakening.
A recent rise in French sovereign risks amid political developments in France is also contributing to higher macro uncertainty. French 5-year Credit Default Swaps (CDS) that insure against a default of the French government have increased to the highest level since May 2020 as the market is increasingly discounting the possibility of a so-called “FREXIT” – an exit of France from the EU and the Eurozone.
In this context, Bitcoin can be viewed as a hedge against sovereign default since it is a counterparty risk-free and censorship-resistant decentralized network. We have presented this kind of sovereign default hedge model in our latest Bitcoin Investment Case report as well.
Further repricing of global growth expectations to the downside amid increasing US recession risks could be a continuing headwind for Bitcoin and cryptoassets in the short term as there tends to be high correlation between our Cryptoasset Sentiment Index and changes in Global Growth Expectations (Chart-of-the-Week).
In this context, it is also important to highlight that changes in global growth expectations have been the most dominant macro factor over the past 6 months, explaining over 80% of the performance variation in Bitcoin over that period.
However, we continue to believe that the recent correction is not a cyclical top, but rather an intermediate correction in the bull market, which is why we suggest using any kind of macro weakness as an opportunity to add exposure ahead of very important developments in the coming months.
One of the main reasons is that we still expect the positive performance effects from the Bitcoin Halving to take effect from summer onwards as explained in one of our Crypto Market Espresso reports.
Moreover, recent comments by SEC chairman Gary Gensler imply that spot Ethereum ETFs in the US are likely going to be launched earlier than September. This is bound to support Ethereum’s performance as well as explained here.
In addition, the recent monetary policy actions by the ECB and Bank of Canada signal that the liquidity tide is already turning which is bound to be a very significant tailwind for Bitcoin and cryptoassets over the medium to long term as explained here. A likely US recession renders a U-turn in Fed monetary policy very likely as well.
Last but not least, the latest political developments in the US show that the political consensus is moving towards a mainstream acceptance of cryptoassets. For instance, Joe Biden’s presidential campaign has recently started to accept crypto payments for campaign financing as well.
Moreover, Joe Biden’s administration will attend a Bitcoin roundtable with congressional officials in DC in order to discuss how to keep Bitcoin and blockchain innovation inside the U.S.
These developments follow recent pledges by Trump to support Bitcoin mining in the US.

In general, among the top 10 crypto assets, Toncoin, XRP, and Ethereum were the relative outperformers.
Overall, altcoin outperformance vis-à-vis Bitcoin has rebounded significantly compared to the prior week, with around 60% of our tracked altcoins managing to outperform Bitcoin on a weekly basis. This is consistent with the fact that Ethereum outperformed Bitcoin by approximately 200 bps last week, which is generally a sentiment gauge for the overall altcoin market.
Sentiment
Despite the recent price correction, our in-house “Cryptoasset Sentiment Index” continues to fluctuate around neutral levels of sentiment.
At the moment, 5 out of 15 indicators are above their short-term trend.
Last week, there were significant reversals to the upside in the altseason index and in the BTC long futures liquidation dominance.
The Crypto Fear & Greed Index signals ”Greed” as of this morning.
Performance dispersion among cryptoassets still remains very low. Most altcoins are still trading in line with Bitcoin.
Altcoin outperformance vis-à-vis Bitcoin has increased significantly compared to the week prior, with around 60% of our tracked altcoins outperforming Bitcoin on a weekly basis, which is consistent with the fact that Ethereum outperformed Bitcoin last week.
In general, increasing (decreasing) altcoin outperformance tends to be a sign of increasing (decreasing) risk appetite within cryptoasset markets and the latest altcoin outperformance could signal increasing appetite for risk at the moment.
Meanwhile, sentiment in traditional financial markets has plunged to the lowest level since November 2023, judging by our own measure of Cross Asset Risk Appetite (CARA).
Fund Flows
Last week, we saw a significant turnaround in net fund flows into global crypto ETPs with around -647.1 mn USD in net outflows.
Global Bitcoin ETPs saw net outflows of -637.1 mn USD last week, of which -580.6 mn USD (net) were related to US spot Bitcoin ETFs alone. Over the past 5 trading days, 4 days have shown negative net outflows.
Flows into Hong Kong spot Bitcoin ETFs were almost flat, with minor net inflows of around +0.3 mn USD, according to data provided by Bloomberg.
The ETC Group Physical Bitcoin ETP (BTCE) saw minor net outflows equivalent to -5.1 mn USD while the ETC Group Core Bitcoin ETP (BTC1) saw net inflows of +0.2 mn USD last week.
The Grayscale Bitcoin Trust (GBTC) saw accelerating net outflows with approximately -274.4 mn USD last week. Although iShares Bitcoin Trust (IBIT) continued to see net inflows (+41.6 mn USD) last week, other major US spot Bitcoin ETFs experienced significant outflows, e.g. FBTC with around -146.3 mn USD in net outflows.
Global Ethereum ETPs also saw a reversal in flows last week, with net outflows totalling -10.9 mn USD.
However, the ETC Group Physical Ethereum ETP (ZETH) continued to see net inflows of +0.2 mn USD last week. The ETC Group Ethereum Staking ETP (ET32) saw neither in- nor outflows last week (+/- 0 mn USD).
Altcoin ETPs ex Ethereum were the only investment vehicles that experienced net inflows of around +4.8 mn USD last week.
Lastly, Thematic & basket crypto ETPs continue to see minor net outflows of -3.9 mn USD, based on our calculations. The ETC Group MSCI Digital Assets Select 20 ETP (DA20) defied negative market trends and managed to attract +0.4 mn USD in net inflows last week.
Meanwhile, global crypto hedge funds continued to trim down their market exposure to Bitcoin aggressively. The beta of global crypto hedge funds’ performance has declined to only 0.59 over the past 20 trading days.
On-Chain Data
Before last week, we observed that net buying volumes on Bitcoin spot exchanges was negative despite ongoing net inflows into global Bitcoin ETPs. The negative volumes have even accelerated last week with -810 mn USD more selling than buying volume on BTC spot exchanges.
While exchanges continue to see net outflows overall, whales have consistently transferred BTC to exchanges on a net basis which has certainly increased selling pressure from large investors.
Whales are defined as network entities that control at least 1,000 BTC. The absolute number of whales has also declined last week which also supports the observation that whales have been distributing coins. Nonetheless, overall exchange balances for both BTC and ETH continue to hover near multi-year lows.
Meanwhile, there is some evidence that BTC miners have also started distributing some coins. However, these distributions appear not to be happening via exchanges but over-the-counter (OTC). OTC daily miner selling volumes have recently spiked to the highest level since March according to data provided by CryptoQuant. There has also been in a minor uptick in BTC miner transfers to exchanges last week and BTC aggregate miner balances have reached the lowest level since April 2019 according to data provided by Glassnode.
The risk is that miner transfers could accelerate if the market continued to trade lower and decrease below many miners marginal cost of production.
In general, Bitcoin network hash rate is still around -8% lower than at the Halving on the 20th of April. So, Bitcoin miners still have not managed to increase their hash rate signalling ongoing economic headwinds. It is interesting to note that based on data provided by the Cambridge Center for Alternative Finance the average efficiency of the global Bitcoin mining fleet has significantly increased since the Halving as the energy consumption per hash has declined from around 80 Joules per terahash (J/Th) to around 26.4 J/Th.
This implies that miners have already shut off and replaced a significant proportion of inefficient mining hardware following the latest Halving which means that the risk of a significant miner capitulation are rather low.
Futures, Options & Perpetuals
Last week, both BTC futures and perpetuals open interest declined somewhat as traders pared down their derivatives exposure. Open interest on CME also declined significantly by around -10k BTC. Meanwhile, both short and long liquidations stayed relatively but the market swung from a dominance in long liquidations to a dominance in short liquidations in a very short period.
This reduction in open interest seems to be consistent with a decline in the Bitcoin futures basis by almost 200 bps compared to the week prior. Meanwhile, the weighted average of perpetual funding rates continued to be positive throughout the week which signals that the recent price correction has not yet induced any kind of short-term capitulation among BTC futures traders.
Bitcoin options’ open interest increased slightly over the course of last week. The slight increase in relative put-call open interest ratios implies that this increase was mostly driven by an increase in put open interest on a net basis. A put option gives the holder the right to sell the underlying at a specific price in the future. Relative put-call volume ratios also increased throughout the week which supports this observation. So, BTC option traders have overall increased their downside bets/hedges last week on a net basis.
The increase in the 25-delta BTC 1-month option skew also corroborates the view that there was increased demand for puts relative to calls.
However, BTC option implied volatilities decreased significantly last week. Implied volatilities of 1-month ATM Bitcoin options are currently at around 45.9% p.a.
Bottom Line
• Last week, cryptoassets underperformed traditional assets as risks to global growth are increasing
• Our in-house “Cryptoasset Sentiment Indicator” continues to fluctuate around neutral levels of sentiment
• Global growth expectations as priced by traditional financial markets have plunged to the lowest level since March 2023 which has negatively affected Cryptoasset Sentiment as well
To read our Crypto Market Compass in full, please click the button below:

This is not investment advice. Capital at risk. Read the full disclaimer
© ETC Group 2019-2024 | All rights reserved


ASWN ETF högavkastande investeringar genom fokus på preferensaktier
iShares noterar 6 nya ETFer på Xetra

SGIG ETF investerar i värdepapper med fast och rörlig ränta

JEYH ETF är högavkastande obligationer hedgade i euro

Record crypto liquidations amid tariff shock

HANetf och Infrastructure Capital Advisors samarbetar för att lansera aktivt förvaltad preferensavkastnings-ETF i Europa

IN0A ETF spårar S&P 500 med fokus på företag med höga ESG-betyg

De bästa lågvolatilitets ETFer på marknaden
PLTY ETP utfärdar optioner mot aktier i Palantir
Time in Bitcoin beats timing Bitcoin
-
 Nyheter4 veckor sedan
HANetf och Infrastructure Capital Advisors samarbetar för att lansera aktivt förvaltad preferensavkastnings-ETF i Europa
-
 Nyheter4 veckor sedan
IN0A ETF spårar S&P 500 med fokus på företag med höga ESG-betyg
-
 Nyheter3 veckor sedan
De bästa lågvolatilitets ETFer på marknaden
-

 Nyheter4 veckor sedan
PLTY ETP utfärdar optioner mot aktier i Palantir
-

 Nyheter4 veckor sedan
Time in Bitcoin beats timing Bitcoin
-

 Nyheter4 veckor sedan
HANetf kommenterar kopparuppgången
-

 Nyheter2 veckor sedan
Fokus mot en helt ny börshandlad produkt i september 2025
-

 Nyheter3 veckor sedan
M5TYs senaste utdelningstakt (55 %) belyser covered call-strategins inkomstpotential