
Nyheter
ETFmarknaden i Europa firar sitt 24-årsjubileum med tillgångar på två biljoner USD

ETFGI, ett ledande oberoende forsknings- och konsultföretag som täcker trender i det globala ETF-ekosystemet, rapporterar att ETFmarknaden i Europa firar sitt 24-årsjubileum med rekordtillgångar på nästan 2 biljoner US-dollar. De första europanoterade ETF:erna gjorde sin debut den 11 april 2000. Dessa två ETFer var baserade på Euro Stoxx 50– och Stoxx Europe 50-indexen, och de var noterade på Deutsche Boerse i Tyskland.
Tillgångar som investerats i ETF-branschen i Europa nådde rekordhöga 1,96 biljoner USD i slutet av mars. Under mars samlade ETF-branschen i Europa nettoinflöden på 11,02 miljarder USD, vilket ger årets nettoinflöden till 49,52 miljarder USD, enligt ETFGIs mars 2024 europeiska ETFer och ETPers industrilandskapsrapport, den månatliga rapporten som är en del av en årlig betald forskningsprenumerationstjänst. (Alla dollarvärden i USD om inget annat anges.)
Höjdpunkter
- Tillgångar som investerats på ETFmarknaden i Europa nådde ett rekord på 1,96 Tn i slutet av mars och slog det tidigare rekordet på 1,90 Tn i slutet av februari 2024.
- Tillgångarna ökade med 7,8 % YTD 2024, från 1,82 Tn USD i slutet av 2023 till 1,96 Tn USD.
- Nettoinflöden på 11,02 miljarder USD i mars 2024.
- YTD nettoinflöden på 49,52 miljarder USD är tredje högsta någonsin efter YTD nettoinflöden på 59,30 miljarder USD 2021 och YTD nettoinflöden på 49,73 miljarder USD 2022.
- Artonde månaden med på varandra följande nettoinflöden.
”S&P 500-indexet ökade med 3,22 % i mars och är upp 10,56 % YTD 2024. De utvecklade marknaderna exklusive det amerikanska indexet ökade med 3,62 % i mars och steg 5,26 % YTD 2024. Spanien (upp 10,72 %) och Italien (upp 6,34 %) såg de största ökningarna bland de utvecklade marknaderna i mars. Emerging markets-indexet ökade med 1,50 % under mars och steg 2,08 % YTD 2024. Peru (upp 10,27 %) och Columbia (upp 8,19 %) såg de största ökningarna bland tillväxtmarknaderna i mars”, enligt Deborah Fuhr, managing partner, grundare och ägare av ETFGI.
Tillgångstillväxt i ETF-branschen i slutet av mars
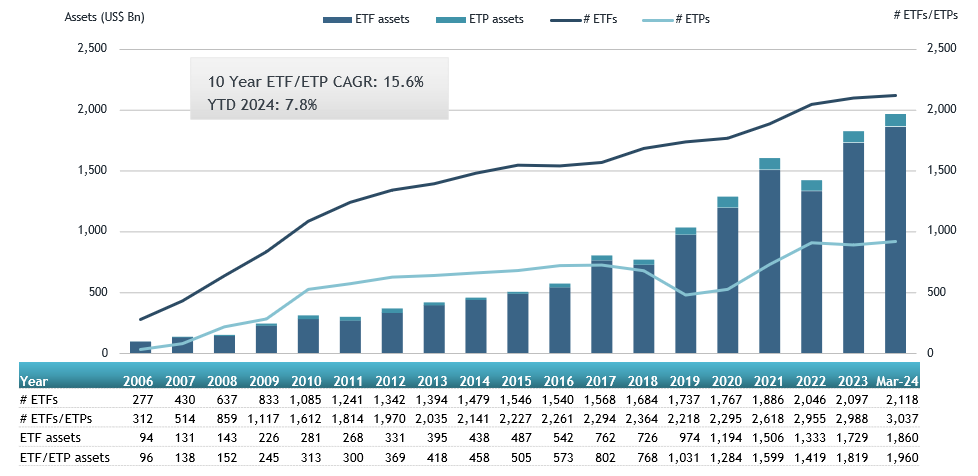
Källa: ETFGI
I slutet av mars hade ETFmarknaden i Europa 3 037 produkter, med 12 209 noteringar, tillgångar på $1,96 Tn, från 99 leverantörer listade på 29 börser i 24 länder.
Under mars samlade ETFer nettoinflöden till 11,02 miljarder USD. Aktie-ETFer samlade nettoinflöden på 9,81 miljarder USD under mars, vilket förde YTD nettoinflöden till 39,30 miljarder USD, högre än 19,38 miljarder USD i nettoinflöden av eget kapital YTD 2023. Ränte-ETFer rapporterade nettoinflöden på 719,00 USD YTD under 1 mars, vilket gav 25 USD nettoinflöden. miljarder, lägre än 15,49 miljarder USD i nettoinflöden YTD år 2023. Råvaru-ETFer rapporterade nettoutflöden på 75,35 miljoner USD under mars, vilket förde YTD nettoutflöden till 2,32 miljarder USD, lägre än 1,67 miljarder USD i nettoinflöden YTD 2023. på 670,27 miljoner USD under månaden, vilket samlade ett nettoinflöde för året i Europa på 2,33 miljarder USD, högre än 2,17 miljarder USD i nettoinflöden YTD 2023.
Betydande inflöden kan tillskrivas de 20 bästa ETFerna av nya nettotillgångar, som samlat in 9,63 miljarder USD under mars. iShares Core S&P 500 UCITS ETF – Acc (CSSPX SW) samlade in 918,91 miljoner USD, det största enskilda nettoinflödet.
Topp 20 ETFer efter nettoinflöden i mars 2024: Europa
| Namn | Kortnamn | Assets ($ Mn) Mar-24 | NNA ($ Mn) YTD-24 | NNA ($ Mn) Mar-24 |
| iShares Core S&P 500 UCITS ETF – Acc | CSSPX SW | 84,308.60 | 4,744.81 | 918.91 |
| UBS ETF (LU) MSCI United Kingdom UCITS ETF (GBP) A-acc – Acc | UC64 | 2,485.72 | 653.33 | 753.94 |
| Invesco MSCI USA ESG Universal Screened UCITS ETF – Acc | ESGU | 2,188.25 | 792.66 | 741.48 |
| Xtrackers II EUR Overnight Rate Swap UCITS ETF – 1C – Acc | DBXT | 7,281.96 | 2,089.43 | 596.35 |
| HSBC S&P 500 UCITS ETF | H4ZF | 6,756.08 | 661.46 | 562.23 |
| iShares MSCI EM ESG Enhanced UCITS ETF | EEDM | 5,000.88 | 886.95 | 556.22 |
| Vanguard FTSE All-World UCITS ETF | VGWL | 24,771.34 | 1,410.78 | 545.51 |
| Invesco S&P 500 UCITS ETF – Acc | P500 | 25,176.99 | 939.08 | 497.72 |
| iShares MSCI ACWI UCITS ETF – Acc | IUSQ | 12,806.01 | 1,453.06 | 469.35 |
| iShares USD Treasury Bond 0-1yr UCITS ETF | IBCC | 14,990.95 | 1,433.49 | 431.07 |
| iShares € High Yield Corp Bond UCITS ETF | EUNW | 7,694.75 | 1,427.77 | 413.53 |
| SPDR S&P 500 UCITS ETF | SPY5 | 12,491.17 | 3,418.58 | 388.74 |
| iShares Core MSCI World UCITS ETF – Acc | EUNL | 75,051.88 | 3,236.70 | 382.75 |
| Amundi Bloomberg Equal-weight Commodity ex-Agriculture UCITS ETF – Acc | LYTR | 1,668.95 | 367.30 | 378.26 |
| iShares STOXX Europe Small 200 UCITS ETF (DE) | SCXPEX | 916.86 | 401.43 | 357.42 |
| Amundi MSCI Japan UCITS ETF – Acc | LCUJ | 4,400.85 | 158.96 | 343.86 |
| UBS ETF (CH) – MSCI Switzerland (CHF) A-dis – Acc | SWICHA | 1,126.17 | 354.69 | 335.87 |
| SPDR MSCI World UCITS ETF – Acc | SPPW | 5,653.51 | 715.38 | 324.95 |
| Amundi S&P 500 Climate Net Zero Ambition PAB UCITS ETF | ZPA5 | 3,965.66 | 925.46 | 320.42 |
| JPMorgan US Research Enhanced Index Equity ESG UCITS ETF – Acc | JREU | 7,047.30 | 1,230.55 | 315.09 |

Källa ETFGI
De 10 bästa ETPerna av nya nettotillgångar samlade ihop 1,69 miljarder USD under mars. WisdomTree Physical Silver – Acc (PHAG LN) samlade in 832,90 miljoner USD, det största enskilda nettoinflödet.
Topp 10 ETPer efter nettoinflöden i mars 2024: Europa
| Namn | Kortnamn | Assets ($ Mn) Mar-24 | NNA ($ Mn) YTD-24 | NNA ($ Mn) Mar-24 |
| WisdomTree Physical Silver – Acc | VZLC | 2,057.21 | 793.35 | 832.90 |
| iShares Physical Silver ETC – Acc | SSLN | 785.65 | 254.30 | 245.97 |
| Xtrackers IE Physical Gold ETC Securities – Acc | XGDU | 3,640.08 | 231.87 | 167.72 |
| AMUNDI PHYSICAL GOLD ETC (C) – Acc | GOLD | 4,575.61 | 307.29 | 127.12 |
| Xtrackers Physical Gold ETC (EUR) – Acc | XAD5 | 2,202.38 | 92.10 | 80.28 |
| WisdomTree Copper – Acc | OD7C | 1,667.78 | 337.85 | 68.51 |
| Xtrackers Physical Gold Euro Hedged ETC – Acc | XAD1 | 1,335.65 | 5.06 | 50.49 |
| SG ETC FTSE MIB -3x Daily Short Collateralized – Acc | MIB3S | 33.07 | 88.10 | 40.49 |
| 21Shares Toncoin Staking ETP | TONN | 40.81 | 39.94 | 39.94 |
| Invesco Physical Gold ETC – EUR Hdg Acc | 8PSE | 564.18 | 59.65 | 33.11 |

Källa: ETFGI
Investerare har tenderat att investera i Equity ETFs under mars.


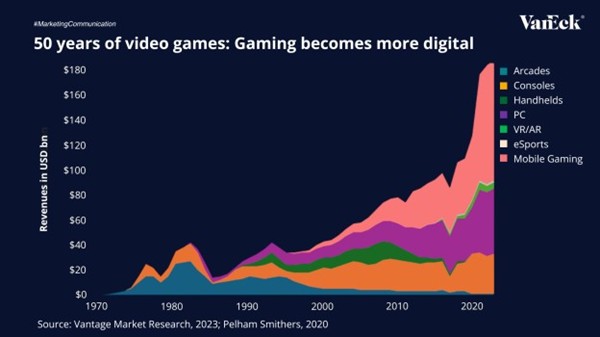
The global gaming industry has evolved into one of the world’s most dynamic entertainment sectors, expected to generate $188.9 billion in 2024 and surpass $200 billion by 2027, outpacing film and music combined.
From arcades to smartphones, the gaming industry has continuously evolved with each technological shift. Today, mobile gaming is a major player the market, currently accounting for the largest share of global revenues. As digital platforms, cloud gaming, and eSports continue to grow, gaming is establishing itself as a core part of the global entertainment economy.
Mobile gaming is leading this transformation, currently accounting for the majority of industry revenues and 40% of all global app downloads. With 5G adoption and 90% smartphone penetration expected by 2030, billions of new players will join the market, making gaming more accessible than ever.
However, the rollout of 5G also carries risks, uneven global infrastructure buildout, high capital costs for carriers, and potential fragmentation across networks could delay or limit the full realization of these benefits.
Source: Vantage Market Research, 2023; Pelham Smithers, 2020
To receive more Gold Investing insights, sign up to our newsletter.
IMPORTANT INFORMATION
This is marketing communication. Please refer to the prospectus of the UCITS and to the KID/KIID before making any final investment decisions. These documents are available in English and the KIDs/KIIDs in local languages and can be obtained free of charge at www.vaneck.com, from VanEck Asset Management B.V. (the “Management Company”) or, where applicable, from the relevant appointed facility agent for your country.


Is Mobile Powering the Future of Gaming?

Fyra nya börshandlade fonder från JP Morgan

AIFS ETF en satsning på infrastruktur för artificiell intelligens

J.P. Morgan Asset Management utökar sitt erbjudande med två nya aktiva ETFer

ISRU ETF köper aktier i stora amerikanska företag

HANetf och Infrastructure Capital Advisors samarbetar för att lansera aktivt förvaltad preferensavkastnings-ETF i Europa

De bästa lågvolatilitets ETFer på marknaden
Time in Bitcoin beats timing Bitcoin

HANetf kommenterar kopparuppgången

Fokus mot en helt ny börshandlad produkt i september 2025
-
 Nyheter4 veckor sedan
HANetf och Infrastructure Capital Advisors samarbetar för att lansera aktivt förvaltad preferensavkastnings-ETF i Europa
-
 Nyheter4 veckor sedan
De bästa lågvolatilitets ETFer på marknaden
-

 Nyheter4 veckor sedan
Time in Bitcoin beats timing Bitcoin
-
 Nyheter4 veckor sedan
HANetf kommenterar kopparuppgången
-
 Nyheter2 veckor sedan
Fokus mot en helt ny börshandlad produkt i september 2025
-

 Nyheter3 veckor sedan
Börshandlade fonder för europeiska small caps
-

 Nyheter3 veckor sedan
M5TYs senaste utdelningstakt (55 %) belyser covered call-strategins inkomstpotential
-

 Nyheter3 veckor sedan
Could Bitcoin be the key to your dream house?