
Nyheter
DeFi ”Defies” the Odds: Thriving Amidst Market Chaos
Uncertainty around the U.S. economy has been taking a toll on Bitcoin and Ethereum, especially with Friday’s underwhelming nonfarm payroll data causing a 6-8% sell-off, re-echoing recession fears. On the institutional side, Bitcoin ETFs witnessed $1.2B in outflows in the eight days through last Friday, before seeing net inflows of $28.6M on September 9. Nevertheless, in the time of turbulence in the broader economy, one crypto-native market has been showing resilience.
Decentralized Finance (DeFi) is a blockchain-based financial market that operates without intermediaries like banks or brokerage firms. Instead, it uses smart contracts to facilitate peer-to-peer activity. Making financial services available to anyone with an internet connection, DeFi eliminates the barriers of traditional finance, while promoting financial autonomy and reducing reliance on centralized institutions. Another main advantage DeFi has over traditional finance is that users can trade around the clock, seven days a week.
Some of the use cases of DeFi include:
• Lending and borrowing: Just like bank loans, platforms like Aave allow users to lend their assets while earning interest, or borrow against collateral.
• Decentralized exchanges (DEXs) function similarly to stock exchanges by enabling users to trade between a variety of crypto pairs. However, instead of relying on centralized market makers, they utilize an automated market-making system (AMM) – pioneered by Uniswap – to facilitate trades in a decentralized manner.
• Stablecoins like Maker’s DAI maintain stable value to provide a way to store and transfer assets without worrying about volatility. Since they’re pegged to a stable asset, such as USD, they are also often used as collateral within DeFi ecosystems.
• Derivatives in DeFi are replicas of complex financial products found in traditional finance, such as options and futures, with cryptoassets in the underlying. In addition, synthetic assets (such as sXAU and sAAPL) allow users to participate in markets that might otherwise be inaccessible.
• Yield farming allows participants to put their idle cryptoassets to use. Users provide liquidity to DeFi protocols to facilitate trades, loans, or other financial services. In turn, these liquidity providers earn passive income in terms of rewards, which can be a portion of transaction fees, governance tokens, or just interest.
Why are we talking about them now?
During market downturns and bearish periods, it’s crucial to take a step back and assess which businesses have fundamental value versus those propelled by hype. For example, DeFi demonstrated relative resilience compared to other crypto segments.
While Bitcoin and Ethereum experienced declines of approximately 6% and 9%, respectively, DeFi as a whole saw a more modest average decrease of around 3% over the last 30 days. For example, Uniswap increased by 6.2%, while Aave grew by 52.5%.
Figure 1 – Monthly Performance of Crypto Sectors
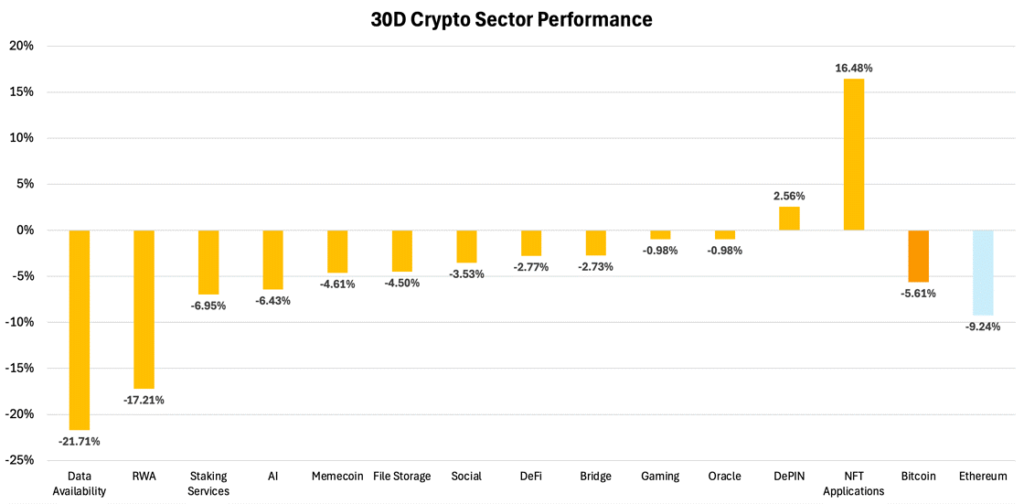
Source: Artemis, 21Shares
Further, when breaking down which businesses are making the most revenue across the space, DeFi protocols stand out, as shown below.
Figure 2 – Top Revenue-generating Protocols, Excluding Smart-contracts Platforms
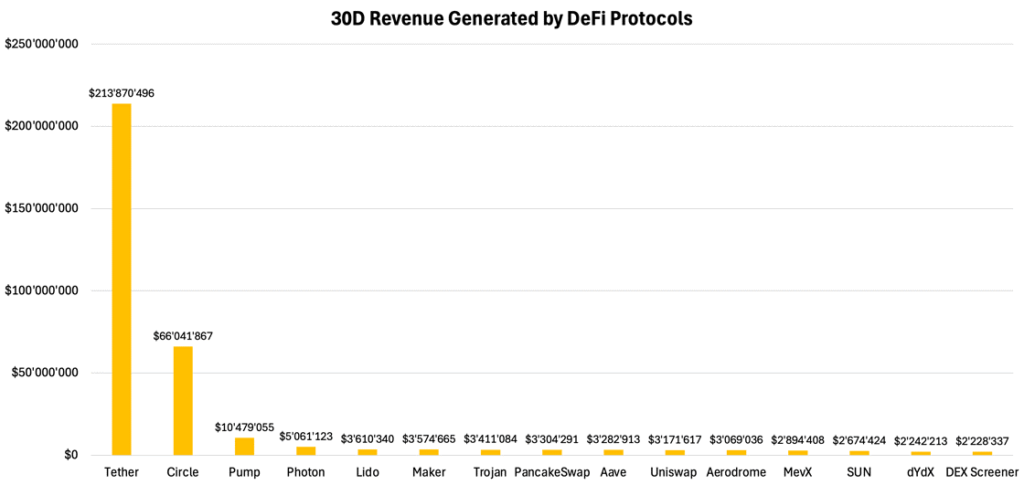
Source: DeFiLlama, 21Shares
Drilling deeper into DeFi, the sector’s growth can be effectively gauged by examining exchange activity, particularly swapping transactions. As exchanges serve as the primary entry point for DeFi, their transaction volume offers valuable insight into the sector’s utilization. Currently, users are executing an average of nearly 2M swap transactions, representing a 10x increase since late 2021 on Uniswap.
Figure 3 – Total Number of Swaps Executed via the Different Iterations of Uniswap
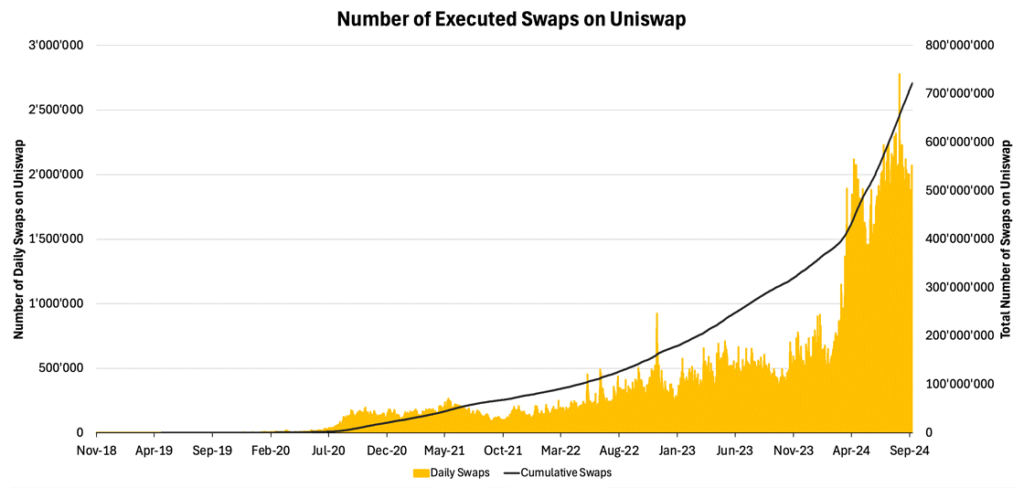
Source: Dune Analytics, 21Shares
Further, DeFi’s monthly revenue nearly matched its November 2021 peak, reaching $70M. Notably, protocols simplifying financial market engagement, such as Pump.fun, have been the primary revenue drivers in this cycle. Pump.fun, which enables users to launch tokens without technical expertise, generated approximately $100M in less than six months. While it’s been primarily focused on meme coins, this trend highlights the growing demand for user-friendly DeFi platforms that lower barriers to participation for individual investors.
Finally, stablecoins are the bedrock of the DeFi ecosystem, serving as a volatility-free haven for crypto capital. Their pivotal role warrants a dedicated deep dive, but for now, let’s examine its remarkable growth since the Luna collapse. For instance, in Q2 of 2024, Tron processed up to one-third ($1.25T) of Visa’s annual settlement volume.
To further contextualize, the total stablecoin market capitalization is approaching its all-time high (ATH), surging approximately 38% from its July 2023 lows to reach $170B. In the same vein, stablecoins now consistently outpace Bitcoin in daily transaction volume, as shown in Figure 4, underscoring their pivotal role in enabling efficient, low-cost payments that aren’t just limited to crypto, as evident by Visa, Stripe, and Shopify’s integrations.
Figure 4 – Weekly Volume of Stablecoins and Bitcoin (USD)
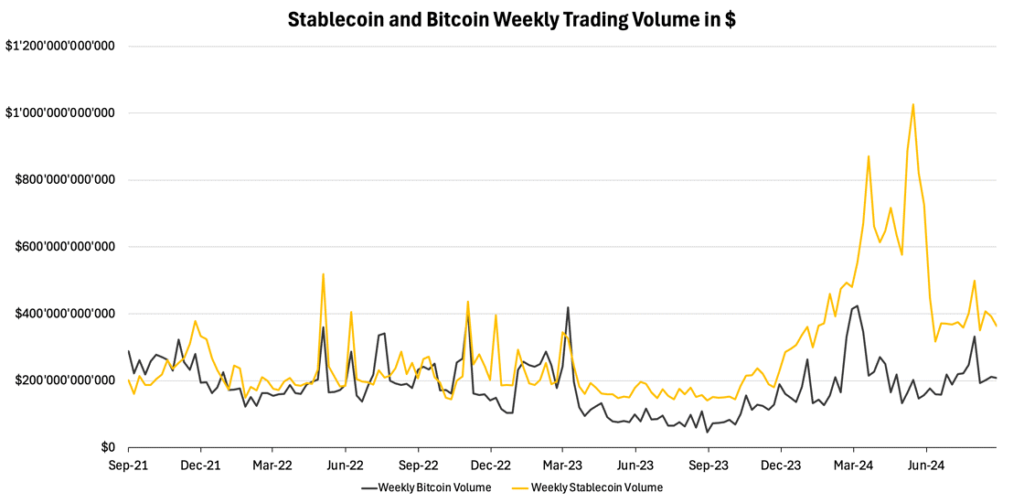
Source: Artemis, 21Shares
So, where do we look?
Now that we’ve demonstrated the compelling value proposition of DeFi and its continued dominance in industry usage let’s examine the three pillars of the ecosystem: Aave, Maker, and Uniswap.
Aave: Crypto’s Leading Lending Platform
Aave is the largest money market protocol. Its token’s price, which surged over 50% from its recent August lows, is now approaching its highest level since May 2022, making it one of the rare market outperformers. While the protocol’s TVL remains approximately 45% below its 2021 peak, Aave demonstrated remarkable year-over-year growth.
Over a 12-month period from Q2 2023 to Q2 2024, the protocol saw net deposits rise by approximately 123%, growing from around $8B to $18B. Fees also surged, increasing from almost $24M to $103M, representing a growth of roughly 335%. This shift dramatically improved the protocol’s financial performance, moving from net losses of $4M by Q2 2023 to positive earnings of $7M by the end of July 2024. As a result, the protocol achieved the lowest Price-to-Fees (P/F) ratio in the last 12 months, at 3.7x.
Most impressively, Aave had the highest monthly active user count, 101.6K, in Q2 of this year, leading to a total cumulative user count of 2.2M. This is remarkable as it shows that the protocol is facilitating meaningful activity and has thereby found its product-market fit, even during times of muted activity.
Figure 5 – Total Amount of Weekly Borrowers
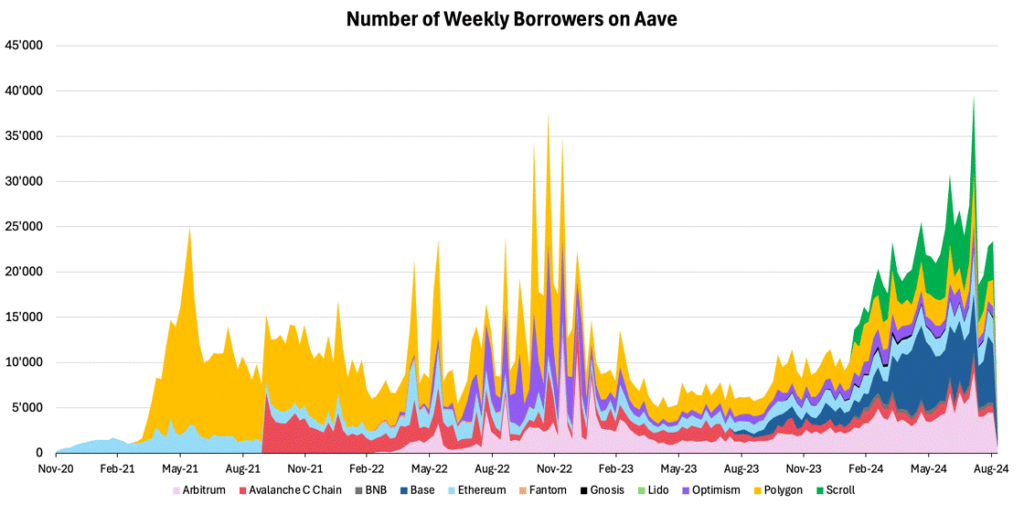
Source: Dune Analytics, 21Shares
In line with this data, Aave’s total number of weekly borrowers reached an ATH in mid-August, as depicted below. This reflects the protocol’s health and its cardinal role within DeFi.
Figure 6 – Total Borrowed Amount on Aave in $
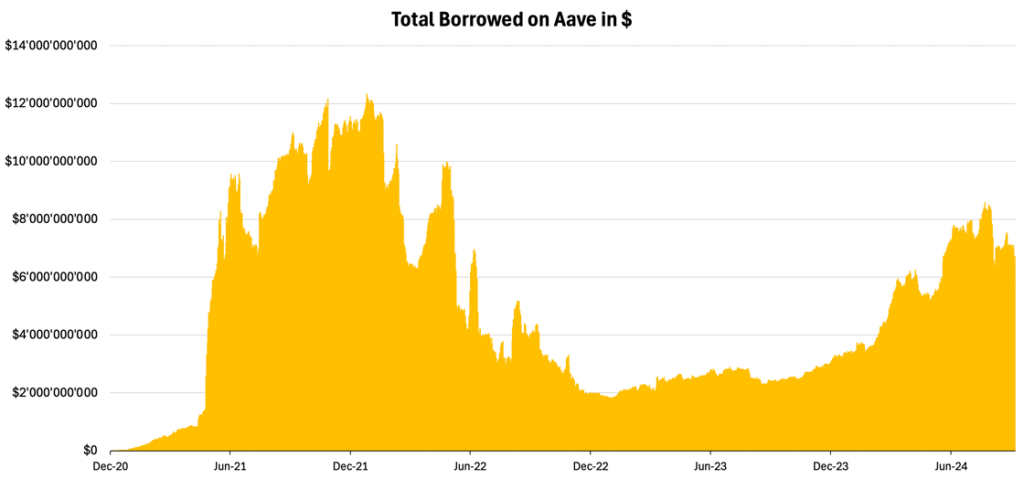
Source: Artemis, 21Shares
TLDR: Despite a 40% decrease in assets’ value amid the broader crypto market slowdown, Aave has significantly expanded its user base across multiple networks. This growth has led to increased revenue, surpassing Q4 2021 levels and resulting in positive earnings of over $7M during the last quarter. With Aave’s strategic expansion plan and its anticipated collaboration with Trump’s DeFi protocol, the outlook for the next few months appears bullish.
Maker: World’s Largest Decentralized Central Bank
Sky, formerly known as Maker, has emerged as the top revenue-generating DeFi application, second only to stablecoin issuers like Tether (USDT) and Circle (USDC). While the full implications of the recent Sky rebranding continue to unfold, the protocol has already made a name for itself by pioneering synergies with traditional finance (TradFi), particularly through the onboarding of tokenized real-world assets onto the crypto ecosystem. This sector now makes up a significant portion of its TVL, particularly in areas such as public and structured credit, as shown below in Figure 7.
Nevertheless, Maker’s primary business remains centered on decentralized lending, which currently accounts for approximately $4B of its $5.5B TVL. Maker’s expertise in lending, alongside its expanding involvement in real-world assets, continues to drive its dominance in the DeFi ecosystem.
Figure 7: Maker TVL by Type
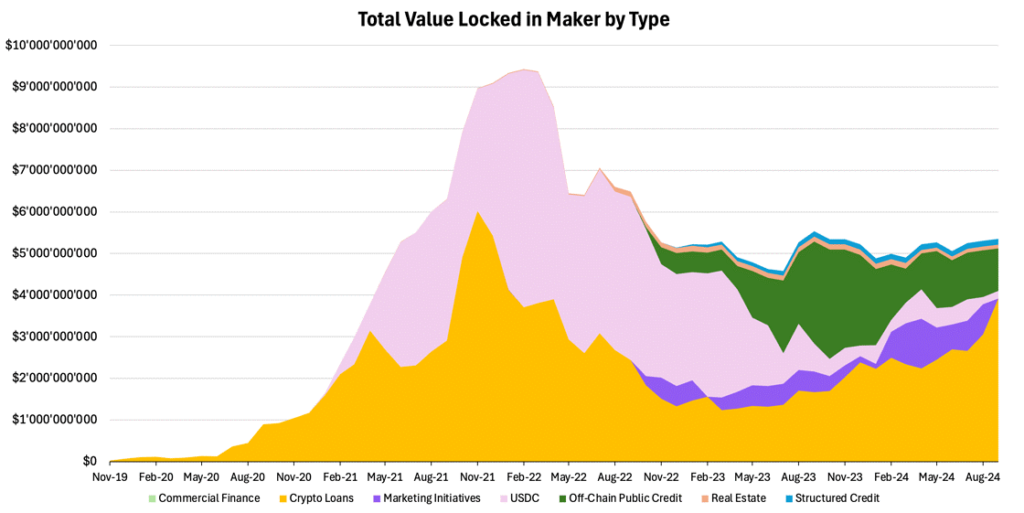
Source: Dune, 21Shares
Despite recent challenges, Maker continues to show resilience in the DeFi landscape. Although the token price dropped 21% last month, the protocol remains positioned for long-term growth, with underlying metrics showing steady momentum.
While Q3 2024 revenue is projected to fall slightly below Q2’s $85M peak, it is still on track to more than double the $33M from Q3 2023. This impressive year-over-year growth highlights Maker’s ability to generate consistent earnings despite varying market conditions.
A standout achievement is Maker’s net treasury, which surged over 10x from $15M in Q3 2023 to $154M in Q3 2024. This strong financial buffer helps shield the protocol from volatility and supports future initiatives like the Sky rebrand, which we’ll break down in a separate edition.
Figure 8: Maker On-chain Revenue by Type
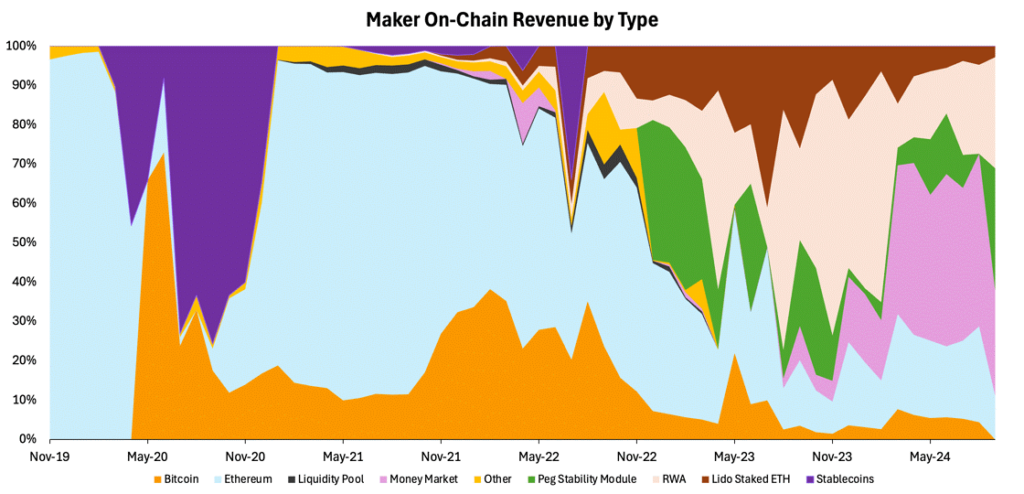
Source: Dune Analytics
User engagement is also on the rise, with monthly active users up 15% this quarter, approaching 3,000. This growing activity reinforces Maker’s product-market fit. With increased revenue and user activity, Maker’s Price-to-Fees (P/F) ratio has improved, dropping from 11.8x in Q3 2023 to 8.1x, suggesting the protocol may be undervalued. As shown in Figure 8 above, Maker’s diversified revenue streams further strengthen its position as a key sustainable DeFi player.
While total borrows on Maker have dropped nearly 45% from their 2021 peak, the protocol has stabilized at a healthy $5B in monthly borrowing, reflecting strong demand for its lending services, as shown in Figure 9. Notably, despite the plateau in borrowing, Maker’s revenue has grown steadily throughout 2023, indicating successful diversification beyond its original use case.
Figure 9: Maker’s Borrowed Amount in $ vs Revenue
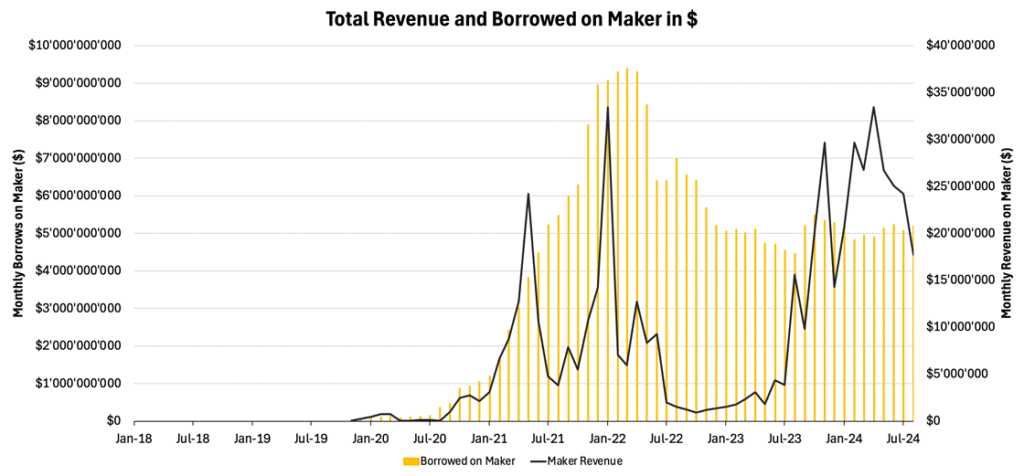
Source: Artemis
TLDR: By expanding into new business lines, Maker is positioned for future growth as DeFi establishes itself as a sector with proven demand. The protocol is well-poised to capitalize on DeFi’s growing adoption and integration with the broader financial ecosystem, securing its place at the forefront of the industry.
Uniswap: Crypto’s Dominant Non-Custodial Stock Exchange
Generally, users prefer non-custodial crypto exchanges, which provide greater security and autonomy compared to centralized exchanges (CEX). Even with the recent market turbulence, the DEX to CEX spot volume is still close to its all-time high, showing that the conviction remains strong around DeFi’s infrastructure.
Being the biggest DEX by TVL and the pioneer behind automated market makers, let’s explore how Uniswap ranks among its centralized counterparts. In Q2, Uniswap made 81% and 65% of Coinbase and Robinhood’s volume, respectively, while just having a fraction of the resources and workforce.
Figure 10 – Uniswap’s Daily Active Users
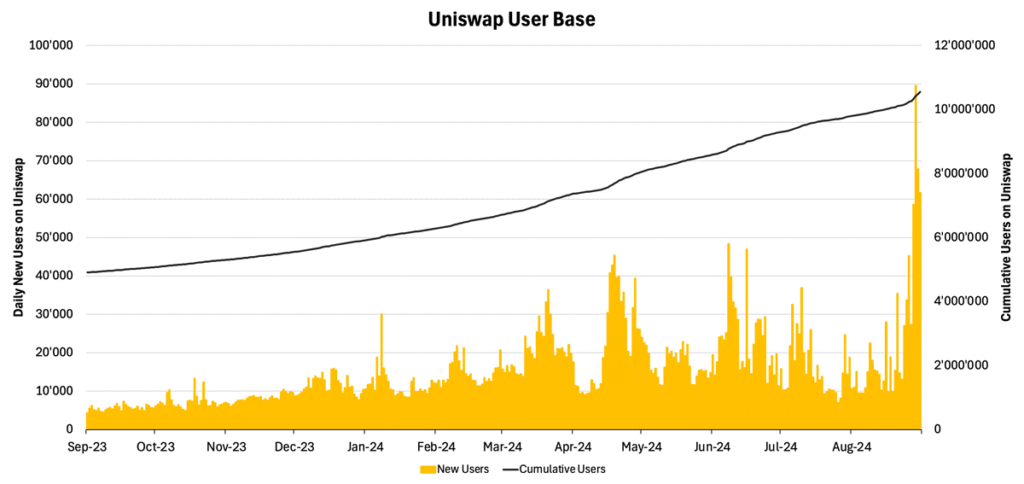
Source: Dune Analytics, 21Shares
In Figure 10, we can see that new users recently climbed to 90K, a number Uniswap never crossed in a single day, let alone at a time of uncertainty in broader markets. Further, with 12M monthly active users, Uniswap enjoys 60% market share. To put matters into perspective, Curve Finance is a DEX that comes right after Uniswap in TVL ranking and has 27.9K monthly users. If we have a look at Uniswap’s centralized competitors, Coinbase has 8M active users and Robinhood has 13.7M.
Assessing Uniswap’s business has to include a look into its revenue streams. In October 2023, Uniswap Labs imposed a 0.15% fee on specific tokens to swaps conducted on its main interface. Over the past six months, Uniswap Labs generated $45M via its interface fee, gulping the lion’s share in the fee generating vertical, excluding Solana-based DEXs, as shown below.
Figure 11 – DEX Trading Fees Market Share
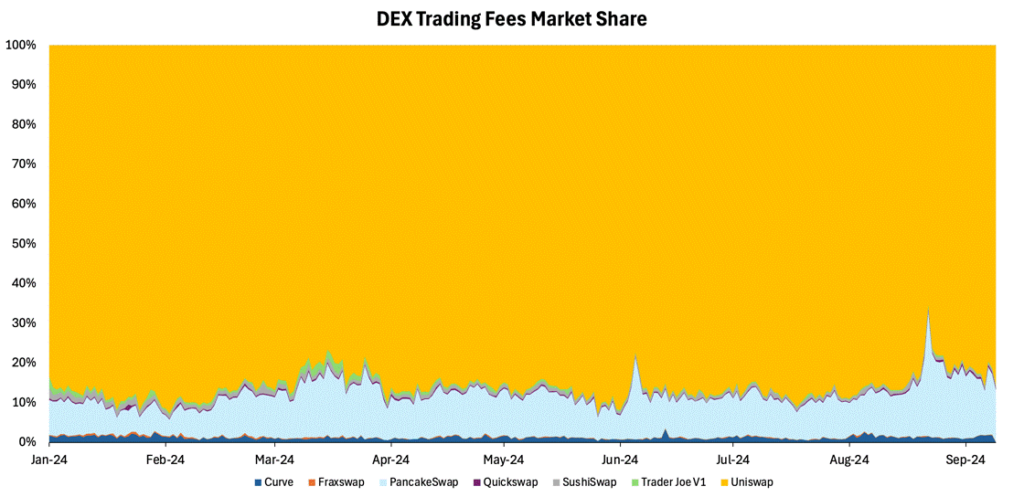
Source: Artemis, 21Shares
TLDR: Despite Uniswap’s lackluster price performance, largely due to perceived utility issues compared to other major DeFi tokens, the protocol’s outlook appears promising. This optimism stems from two key factors: increasing revenue from its interface fee and the potential activation of the fee switch. The market’s reaction to the fee switch news in February was notably positive, with the token surging nearly 130%. All in all, Uniswap’s dominant position in the DEX sector, evidenced by its substantial fee generation and expanding user base, could position it as a relevant barometer for the broader DeFi landscape.
So, what are the key catalysts that could reignite the industry in the coming months?
• Fee-switch and Domino Effect on DeFi:
o In February, the Uniswap Foundation proposed activating the fee-switch, allowing token holders to share protocol revenue. Though paused, this move signaled a shift in DeFi towards transforming simple governance tokens into revenue-generating assets. Aave is now considering a similar feature, and we expect more protocols to pursue similar value accrual mechanisms.
• Falling interest rates
o As central banks lowered borrowing rates during the pandemic to stimulate economic growth, savings accounts offered unattractive yields, driving some investors to DeFi for higher returns. Although early yields were unsustainable, the sector has since relatively matured with the integration of tokenized assets, blending yields from both traditional and decentralized finance. This evolution could become a key advantage as rates continue declining in the coming months.
• Trump’s DeFi Project
o While many details are still pending, World Liberty Project appears to be a lightweight, non-custodial lending protocol designed to integrate with Aave. This setup allows users to deposit into without forking the protocol itself. The project could significantly impact Aave, enhance confidence in DeFi platforms, and consequently drive up sector valuations. It could underscore the benefits of stablecoins, which the platform is expected to heavily rely on, if it doesn’t stir regulatory scrutiny.
• Simplified User Interface
o Apple’s new NFC policy could significantly increase the demand for stablecoins by unlocking their utility as an alternative payment method through their devices, via tap-to-pay. This change could elevate DeFi’s infrastructure role, though the impact will largely be felt behind the scenes, with users primarily noticing the convenience in terms of cost efficiency.
o Features like account abstraction will enable users to create and recover smarter crypto wallets using Web2 credentials, offering a more user-friendly experience reminiscent of fintech platforms.
For investors looking to gain exposure to the DeFi ecosystem, one of the most established sectors with a proven product-market fit, 21Shares offers the following ETPs on the European market. These investment products provide a regulated way to invest in leading DeFi protocols and capture growth opportunities within this rapidly evolving sector.
Figure 12 – Top Aave ETPs by Assets under Management
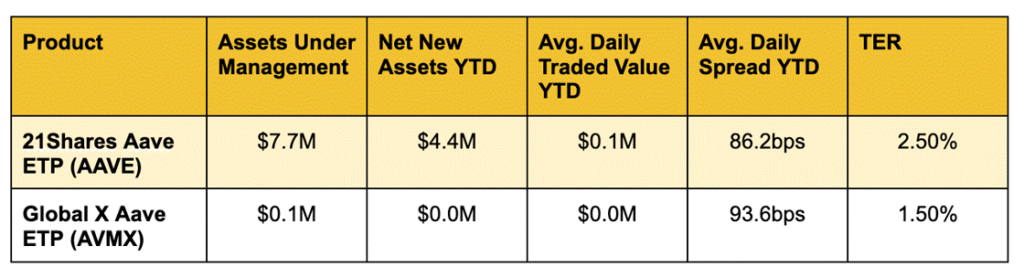
Source: Bloomberg, Data as of September 10, 2024.
Avg. Daily Spread YTD: refers to the best daily average bid/ask spread this year across European exchanges.
Figure 13 – Top Uniswap ETPs by Assets under Management
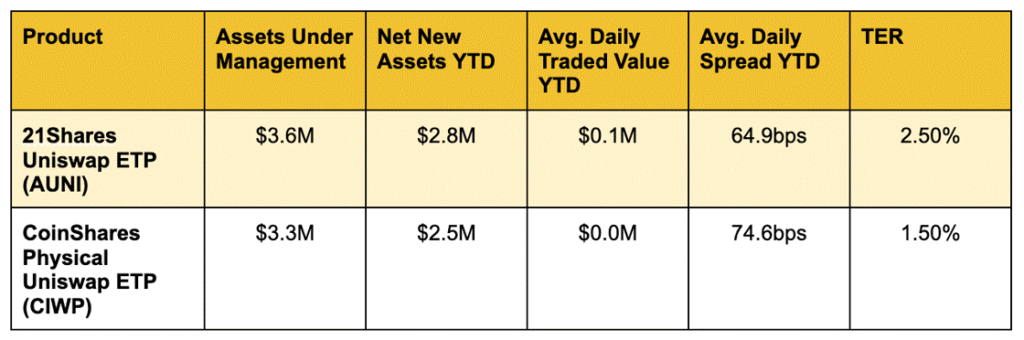
Source: Bloomberg, Data as of September 10, 2024.
Avg. Daily Spread YTD: refers to the best daily average bid/ask spread this year across European exchanges.
Figure 14 – Top Maker ETPs by Assets under Management
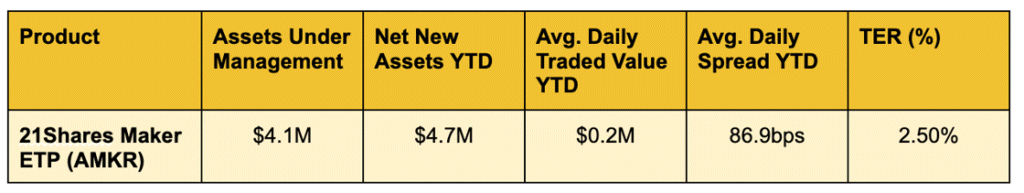
Source: Bloomberg, Data as of September 10th, 2024.
Avg. Daily Spread YTD: refers to the best daily average bid/ask spread this year across European exchanges.
What’s happening this week?
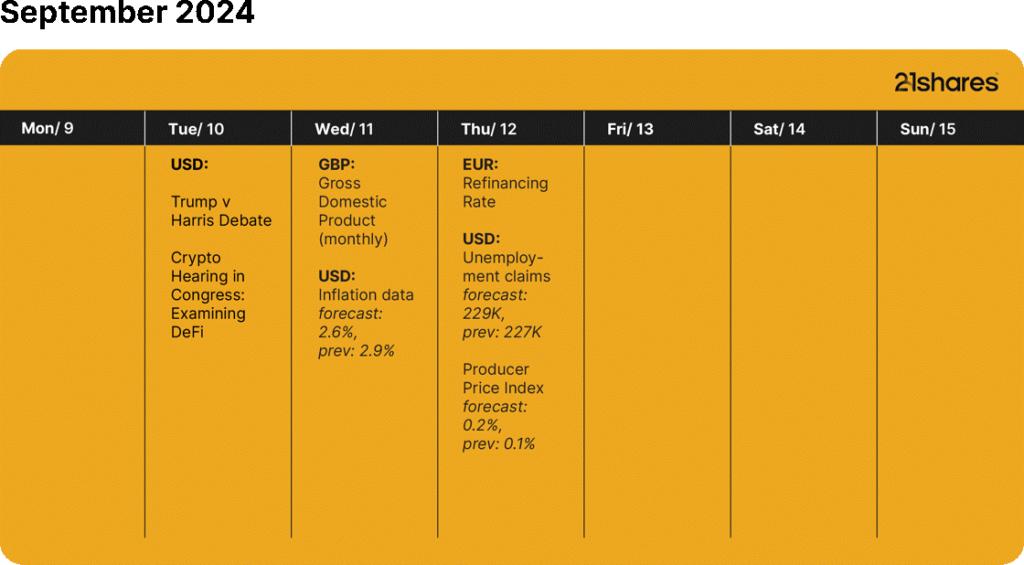
Source: Forex Factory, 21Shares
Research Newsletter
Each week the 21Shares Research team will publish our data-driven insights into the crypto asset world through this newsletter. Please direct any comments, questions, and words of feedback to research@21shares.com
Disclaimer
The information provided does not constitute a prospectus or other offering material and does not contain or constitute an offer to sell or a solicitation of any offer to buy securities in any jurisdiction. Some of the information published herein may contain forward-looking statements. Readers are cautioned that any such forward-looking statements are not guarantees of future performance and involve risks and uncertainties and that actual results may differ materially from those in the forward-looking statements as a result of various factors. The information contained herein may not be considered as economic, legal, tax or other advice and users are cautioned to base investment decisions or other decisions solely on the content hereof.


JRWE ETF en globalfond valutasäkrad i Euro

Single-stock options income ETPer finns nu tillgängliga i Nederländerna för första gången

QQQY ETP dagliga optioner på indexet och månadsvis utdelning

Is Mobile Powering the Future of Gaming?

Fyra nya börshandlade fonder från JP Morgan

HANetf och Infrastructure Capital Advisors samarbetar för att lansera aktivt förvaltad preferensavkastnings-ETF i Europa

De bästa lågvolatilitets ETFer på marknaden

Fokus mot en helt ny börshandlad produkt i september 2025

HANetf kommenterar kopparuppgången

Börshandlade fonder för europeiska small caps
-
 Nyheter4 veckor sedan
HANetf och Infrastructure Capital Advisors samarbetar för att lansera aktivt förvaltad preferensavkastnings-ETF i Europa
-
 Nyheter4 veckor sedan
De bästa lågvolatilitets ETFer på marknaden
-
 Nyheter2 veckor sedan
Fokus mot en helt ny börshandlad produkt i september 2025
-
 Nyheter4 veckor sedan
HANetf kommenterar kopparuppgången
-
 Nyheter3 veckor sedan
Börshandlade fonder för europeiska small caps
-

 Nyheter3 veckor sedan
M5TYs senaste utdelningstakt (55 %) belyser covered call-strategins inkomstpotential
-

 Nyheter3 veckor sedan
Could Bitcoin be the key to your dream house?
-

 Nyheter1 vecka sedan
Levler noterar ytterligare fyra börshandlade fonder i Sverige