
Nyheter
Crypto Regulations Brew as Bitcoin Surges in Institutional Adoption: What Happened in Crypto This Month?
• Crypto Regulations Brew in May As Elections Inch Closer
• Lots of Institutional Demand, Bitcoin to Climb Mt. Gox
• Ethereum’s Watershed Moment
• Chainlink Continues Powering Tokenization
Crypto Regulations Brew in May As Elections Inch Closer
With the first presidential debate scheduled for June 27, regulating crypto is becoming an increasingly inevitable hot topic in the lead-up to the elections. The competition heats up again, reminiscent of the 2020 race. However, this time, it’s Joe Biden who is defending his presidency, and both candidates are even represented on Solana’s blockchain with meme tokens in their names. Republicans have been fiercely embracing crypto in Congress, achieving bipartisan agreement for the first time. Once a skeptic himself, Donald Trump has recently vouched for the industry, leaving the Biden administration in limbo with regard to pending crypto regulations.
Restrictions on crypto custody may be easing, encouraging financial institutions in the U.S. to hold crypto on behalf of their clients. The House passed a bill on May 8, nullifying the Securities and Exchange Commission’s (SEC) 121st Staff Accounting Bulletin. SAB 121 requires banks holding customers’ cryptoassets to present a liability on their balance sheet to reflect their obligation to safeguard them, potentially leading to substantial capital expenses. On May 16, the Senate approved the bill before it landed in the White House, which vocalized its intention to veto it as it would allegedly undermine the SEC’s work to protect investors. The Biden administration has until June 3 to veto. However, if SAB 121 is overturned, it would diversify crypto custodians, only four of which are currently servicing the 11 Bitcoin Spot ETFs, a major concern for Congress. Moreover, the bill would be advantageous for investors who are discouraged from holding crypto outside traditional frameworks.
For years, the distinction between the SEC’s jurisdiction over crypto and that of the Commodities and Futures Trading Commission (CFTC) has been blurry. The Financial Innovation and Technology for the 21st Century Act (FIT21) would provide the CFTC with new jurisdiction over digital commodities and clarify the SEC’s jurisdiction over digital assets offered as part of an investment contract based on the degree of decentralization of a crypto network. The bill has also laid out five conditions for a “decentralized system:”
- No one person can control the network or prevent others from using it. This means that no one can solely decide how it works or who can use it.
- No entity should own more than 20% of its native cryptoasset.
- The decentralized system’s code should be open-source and can’t be majorly modified by a single person. Unless it’s to fix vulnerabilities and improve security, consensus on code updates should be reached through a decentralized governance system.
- No one from the founding team or anyone affiliated with the network should promote its cryptoasset to the public as an investment.
- The cryptoassets minted over time, through the programmatic functioning of the blockchain, should be distributed to the end-user, not a select few.
This sets a new precedent. It’s the first time decentralization enters the legal conversation in that context as a priority, a gauge for how close an asset is to a commodity. Although still pending the green light from the Democrat-controlled Senate, FIT21 has already forged the path for networks to work actively toward achieving sufficient decentralization.
We believe that regulatory clarity is bound to be reached, especially with these two bills brewing in Congress. Many drew parallels between FIT21 and Europe’s iconic crypto framework ratified earlier this year, Markets in Crypto Assets (MiCA). Both legislations suggest conducting a study to better understand and, in turn, better regulate the burgeoning realm of decentralized finance. That said, crypto is still an inevitable topic of discussion in Europe. The European Securities and Markets Authority (ESMA) invited investors, and trade associations, among others, for consultation to assess possible benefits and risks of its Undertakings for Collective Investment in Transferable Securities (UCITS), gaining exposure to cryptoassets and 18 other asset classes. ESMA has until August 7 to gather input. UCITS funds are generally considered safe, well-regulated investments sustaining €12T in market valuation. Thus, the funds are vital for crypto as UCITS accounts for 75% of all collective retail investments in the EU. Thus, if the conclusions of this consultation are in favor of adopting crypto, it would attract an influx of investors and bring more regulated accessibility to this asset class. Moreover, although still under consultation, ESMA’s deliberation adds more credibility to crypto, considering its renowned strict regulatory standards.
Finally, June’s calendar is almost blocked for many anticipated events that would forecast the continued trend of shifting policy. Due to increasing political pressure, we may see inactive bills resurface in the Senate. For example, the bipartisan support for FIT21 could bring back pending bills such as Clarity for Payment Stablecoins and Keep Your Coins. However, this renewed legislative activity alone could not exclusively impact the financial landscape, as macroeconomic headwinds still deeply affect crypto. The next monetary policy meeting will be held on June 12, which will pave a clearer path for rate cuts, with inflation data coming out right before. Following the same sentiment, the U.S. Treasury’s buyback program, which started on May 29, will buy back $2B in weekly bond repurchases. This reduces outstanding debt while increasing overall liquidity, potentially allowing capital to flow into riskier assets.
Lots of Institutional Demand While Bitcoin Climbs Mt. Gox
May was an exciting month for crypto, with institutional interest in Bitcoin growing and inflows increasing after a quiet April, as shown in Figure 1. The 13F filing deadline on May 15 revealed significant institutional exposure to Bitcoin. By the end of Q1, 937 professional investors owned $11B in U.S. Bitcoin Spot ETFs, about 20% of the ETFs’ total assets. In contrast, Gold ETFs had only 95 professional investors in their first quarter post-launch, representing less than 10% of Bitcoin ETFs’ reach. The adoption of Bitcoin is unsurprising given the accessibility that Bitcoin ETFs offer traditional institutions through a regulated investment vehicle. The full breakdown of Bitcoin ETF adoption can be found here.
Figure 1 – U.S. Bitcoin Spot ETF Flows (USD)
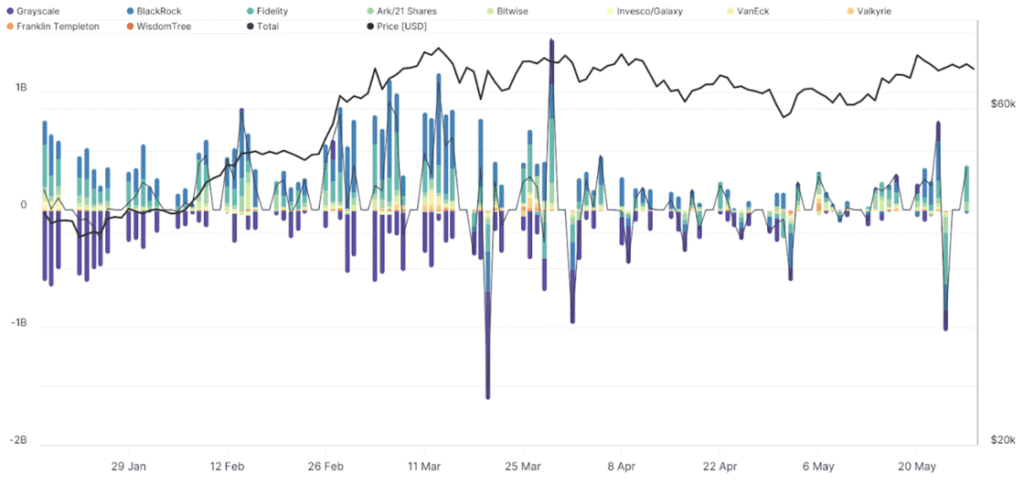
Source: Glassnode
Bitcoin’s role as a safe haven was reinforced in Japan, where economic pressures led Metaplanet to adopt Bitcoin as a strategic reserve asset, acquiring over $7M since April. International interest in Bitcoin continued, with the approval and launch of BTC and ETH exchange-traded notes (ETNs) in the U.K. for professional investors, showcasing the growing appetite for the asset class.
Despite the optimism surrounding Bitcoin’s institutional adoption, the market is expected to face a headwind due to a decade-old exploit. Mt. Gox, once handling nearly 70% of all Bitcoin transactions, was hacked in 2014, losing 750K BTC, with 200K later recovered. Reparation initiatives were instituted to reimburse creditors with 142K BTC, 143K BCH, and 69B Japanese yen by October 31. Recent observations reveal that wallets associated with the exchange transferred approximately $9B of assets to a single address, likely part of the reimbursement plan. This rendered Bitcoin unable to break the resistance level at $70K due to the fears of potential sell-offs. However, since investors affected by Mt. Gox are early adopters who likely still believe in the asset class, selling pressure may be milder than expected. Once repayments are completed, another looming market uncertainty should be lifted, allowing Bitcoin to finally move on.
Figure 2 – Mt. Gox BTC Balance in BTC and USD
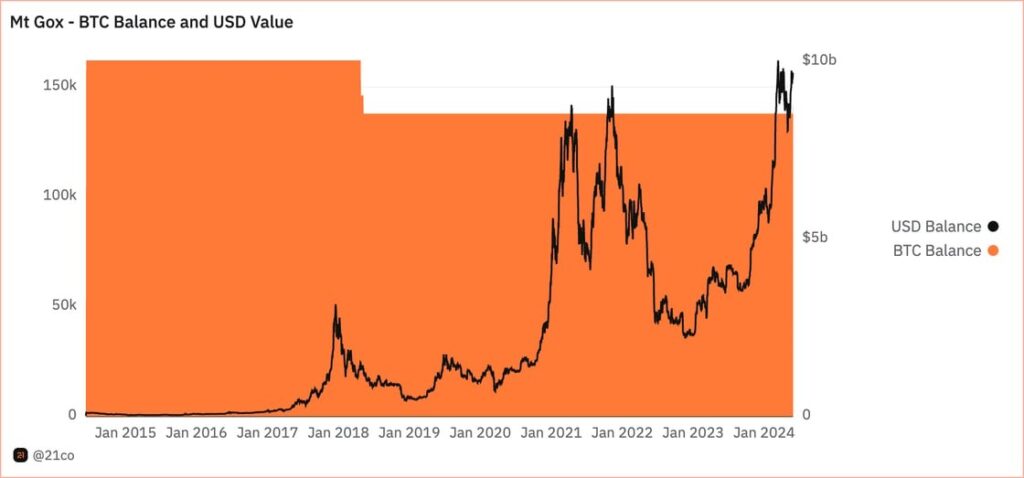
Source: 21co on Dune
Ethereum’s Watershed Moment
The most significant takeaway from May was the SEC’s approval of Ethereum Spot ETFs’ 19b-4 filings on May 23, marking a crucial milestone for the crypto industry. While the approval does not explicitly designate Ethereum as a commodity, it is implied by classifying these ETFs as “commodity-based trust shares.” These products are not tradable until the agency approves the S1 filings, which could take weeks or months; hence, investors must be patient to see the impact of these ETFs. Nevertheless, this moment signals a growing acceptance of Ethereum within regulated investment frameworks, potentially opening the market to significant inflows from Registered Investment Advisors and the local ETF market, with the latter valued at $8T.
Nevertheless, investors should exercise caution in the lead-up to the U.S. ETH ETF launch, given the “buy the rumor, sell the news” phenomenon observed after the BTC ETF launch, where Bitcoin’s price retraced 18% before rallying 90%, as shown in Figure 3. This phenomenon is already occurring, with Ethereum catching up to Bitcoin’s performance when news of the approvals broke. However, the impact of ETH ETFs might differ due to the asset’s distinct attributes.
Figure 3 – ETH and BTC Performance Since December 2023
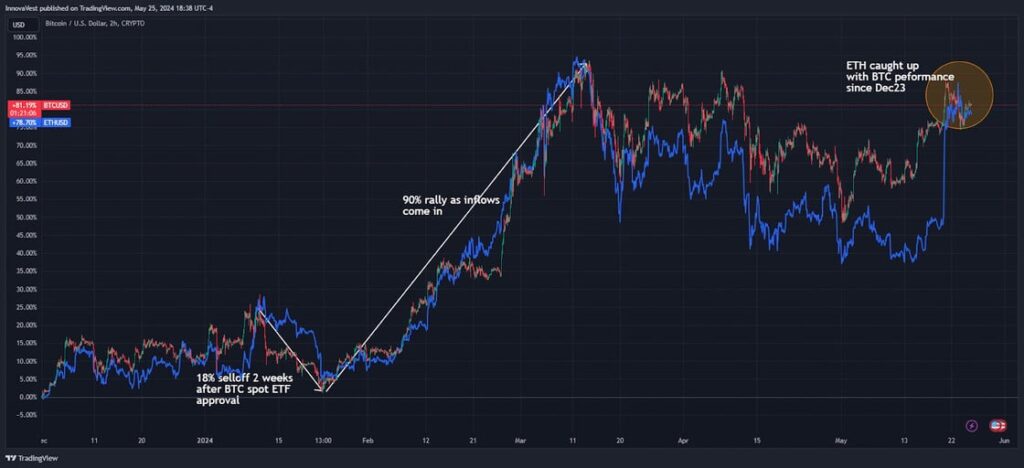
Source: TradingView
U.S. ETH ETFs might follow the trend in Hong Kong, where their counterparts launched alongside BTC ETFs but attracted only about 20% of the latter’s assets under management, around $250M. Further, the absence of staking in the products removes a crucial component of Ethereum’s investment appeal. Investors purchasing these ETFs will miss out on staking rewards, which they could otherwise access by holding and staking ETH directly. On the positive side, the lack of staking features in the ETFs means the yield isn’t diluted for the wider community!
Additionally, ETH’s utility, as collateral in lending agreements or for minting NFTs, to name a few, is sacrificed when investing via ETFs. That said, many institutions accessing Ethereum through these ETFs have no option but to use regulated vehicles. Despite this, they are expected to generate excitement, opening a regulated investment avenue to the next-generation decentralized app store. This is especially significant with the network’s upcoming upgrade in Q1 of 2025. For additional details, refer to our breakdown, discussing some of the anticipated features.
Nonetheless, the SEC approval adds credibility to a broader range of cryptoassets, indicating that Bitcoin is not the only ’legitimate’ one in the eyes of regulators. With FIT21 developing, we could be heading to a future where a wider array of decentralized protocols could be integrated into the stock market, fostering and embracing technological innovation and adoption. Further, Ethereum’s approval represents a significant step forward, highlighting the value of its on-chain ecosystem of decentralized applications. Indeed, May was a landmark month, further solidifying mainstream acceptance, with the approval underscoring broader integration of cryptoassets within traditional financial markets, which could set the stage for tokenization, one of the most disruptive financial innovations in recent years.
Chainlink Continues Powering Tokenization
On May 17, the Depository Trust and Clearing Corporation (DTCC), the world’s largest securities settlement system, which processed $3 quadrillion in securities in 2023, announced it completed a pilot project in collaboration with Chainlink and major financial institutions such as BNY Mellon and JP Morgan. The project builds upon the existing DTCC Mutual Funds Profile Service I (MFPS I), which is the industry standard for transmitting NAV data, such as fund price and rate. The pilot does not affect initial portions of the workflow, such as calculating fund data. The focus was to create a standardized way to disseminate fund information across different blockchains. That said, the project will likely expedite real-world asset tokenization, which has become an increasingly important industry segment, showcased by tokenized government securities growing 20x in assets under management since the start of 2023, from nearly $100M to almost $2B.
Figure 4 – Market Landscape of Tokenized Government Securities by Product
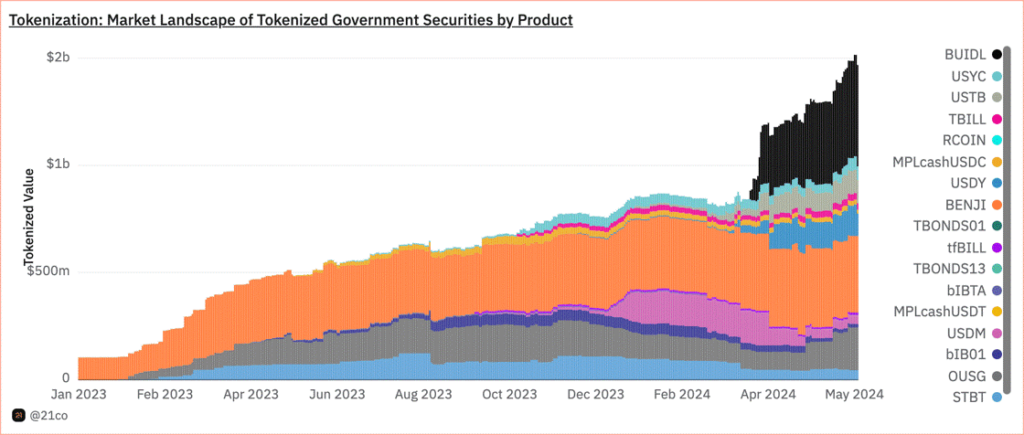
Source: 21co on Dune Analytics
In its existing model, the DTCC service handles the daily transmission of price and rate data for numerous mutual fund securities. The current NAV model connects funds and service providers to distributors, collecting and disseminating relevant data via message queues and file-based methods at regular intervals. On the other hand, Smart NAV extends the dissemination capabilities of MPFS I. Instead of data just being sent through existing channels, it is transformed into a modern data structure that is wrapped into a blockchain transaction, signed by DTCC’s private keys, and finally routed to Chainlink’s Cross-Chain Interoperability Protocol (CCIP). This allows relevant fund data to be sent across almost any blockchain, private or public. Once the fund data is transmitted to these networks, a CCIP-based smart contract forwards the data to the Smart-NAV-specific smart contracts responsible for validating permissions and storing data for parties to consume.
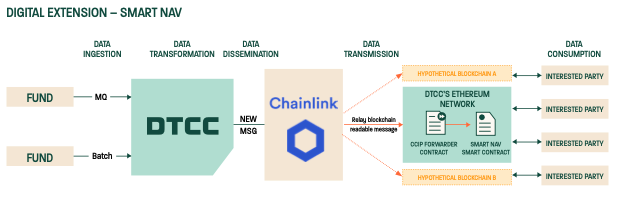
That said, the project’s workflow is a significant improvement as it enables a more efficient way of sharing both real-time and historical information. It also spares experimenting institutions from the need to connect directly to each blockchain where tokenized assets are held, which would be challenging to manage independently. Thus, Chainlink’s role is crucial in creating a seamless cross-chain tokenized environment, which we believe represents the future. We are observing the early stages of this development as tokenized assets currently span across eight networks and are expected to proliferate further.
Although this project is in its pilot phase, we’ll closely monitor it due to its potential impact on the embryonic tokenization industry. It’ll also highlight how blockchain-based systems are superior in standardizing and distributing data, reducing the disruption to existing market practices, and simplifying access to historical data. Thus, we expect these advancements to enhance efficiency, automation, and innovation across various financial industries.
From Chainlink’s perspective, this integration could be crucial for enhancing the network’s economics, given the significantly larger market opportunity for interoperability compared to its other products like smart-contract automation, verifiable on-chain randomness, and data feeds. For context, Chainlink has generated $384M in revenue from price/data feeds versus $750K from CCIP, primarily because feeds have been Chainlink’s oldest and most established product. However, CCIP has the potential to generate much higher revenue, as the total addressable market for tokenization is expected to reach $10T by 2030. A key factor in achieving this will be the interconnectivity between different counterparties and the seamless onboarding of consumers, who won’t need to differentiate between various layers of infrastructure.
Next Month’s Calendar

Source: Forex Factory, 21Shares
Research Newsletter
Each week the 21Shares Research team will publish our data-driven insights into the crypto asset world through this newsletter. Please direct any comments, questions, and words of feedback to research@21shares.com
Disclaimer
The information provided does not constitute a prospectus or other offering material and does not contain or constitute an offer to sell or a solicitation of any offer to buy securities in any jurisdiction. Some of the information published herein may contain forward-looking statements. Readers are cautioned that any such forward-looking statements are not guarantees of future performance and involve risks and uncertainties and that actual results may differ materially from those in the forward-looking statements as a result of various factors. The information contained herein may not be considered as economic, legal, tax or other advice and users are cautioned to base investment decisions or other decisions solely on the content hereof.


Vilka ETFer investerar i europeiska Small Cap-aktier?

TLCO ETF är en satsning på telekommunikation

Ny strategi riktar in sig på avkastning från terminskurvans dynamik

DOGE ETP är den enda Dogecoin ETP som godkänts av Dogecoin Foundation

Janus Henderson noterar CLO UCITS ETF på Xetra

Montrose storsatsning på ETFer fortsätter – lanserar Sveriges första globala ETF med hävstång

MONTLEV, Sveriges första globala ETF med hävstång

Sju börshandlade fonder som investerar i försvarssektorn

Världens första europeiska försvars-ETF från ett europeiskt ETF-företag lanseras på Xetra och Euronext Paris

Europeisk försvarsutgiftsboom: Viktiga investeringsmöjligheter mitt i globala förändringar
-
 Nyheter4 veckor sedan
Montrose storsatsning på ETFer fortsätter – lanserar Sveriges första globala ETF med hävstång
-
 Nyheter4 veckor sedan
MONTLEV, Sveriges första globala ETF med hävstång
-
 Nyheter4 veckor sedan
Sju börshandlade fonder som investerar i försvarssektorn
-
 Nyheter3 veckor sedan
Världens första europeiska försvars-ETF från ett europeiskt ETF-företag lanseras på Xetra och Euronext Paris
-
 Nyheter4 veckor sedan
Europeisk försvarsutgiftsboom: Viktiga investeringsmöjligheter mitt i globala förändringar
-

 Nyheter3 veckor sedan
21Shares bildar exklusivt partnerskap med House of Doge för att lansera Dogecoin ETP i Europa
-

 Nyheter2 veckor sedan
HANetfs Tom Bailey om framtiden för europeiska försvarsfonder
-

 Nyheter1 vecka sedan
Fastställd utdelning i MONTDIV april 2025