
Nyheter
Crypto Markets Persevere, Investor Appetite for Web 3 Grows, and More!
The banking default risk in the United States started spreading to European banks, taking down Credit Suisse with a takeover by UBS. However, for the second consecutive week, the crypto markets performed in the opposite direction of the macro headwinds. Bitcoin was the biggest winner of last week’s rally, increasing by 15.5%, while Ethereum increased by 3.9%. The biggest losers were Polygon (-6.72%), Maker (-26%), and Lido (-13.86%), which announced it would launch withdrawals of staked ETH by mid-May, two weeks after Ethereum’s Shanghai upgrade.
Figure 1: Weekly TVL and Price Performance of Major Crypto Categories
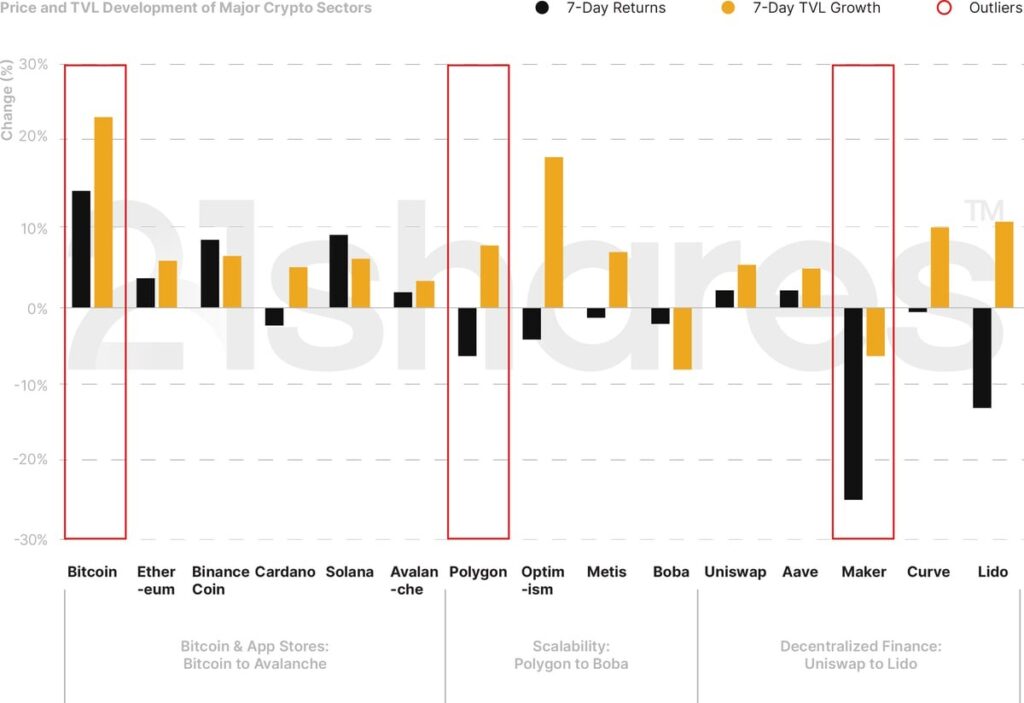
Source: 21Shares, CoinGecko, DeFi Llama. Close data as of March 20.
Key takeaways
• Crypto’s market cap increases by 8.5%, despite the looming default crisis in traditional finance.
• Arbitrum unveils token, Cosmos launches Replicated Security
• Lido Finance anticipates mainnet withdrawals by mid-May; National Australian Bank conducts its first Cross Border transaction using its own stablecoin on Ethereum
• Saudi Arabian NFT marketplace “Nuqtah” raises seed funding from Animoca Brands and Polygon.
Figure 2: Bitcoin Options Open Interest By Expiry
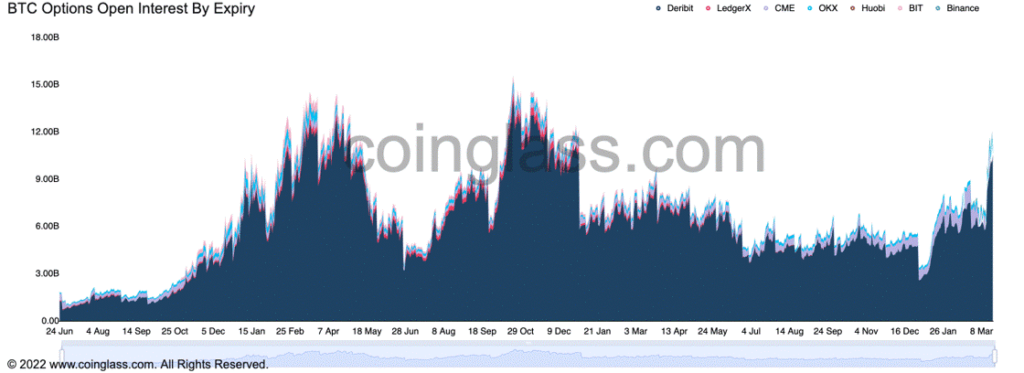
Source: Coinglass.com
Spot and Derivatives Markets
Demand for Bitcoin options contracts has increased to levels we haven’t seen since 2021, inching close to $12B on March 19 alone, with Deribit enjoying the lion’s share of ~$10B. This could mean a trend of allocating investments in cryptoassets as a hedge against inflation and the default contagion risk going around in the banking sector.
On-chain Indicators
Figure 3: Ethereum’s Network Value to Transactions Ratio
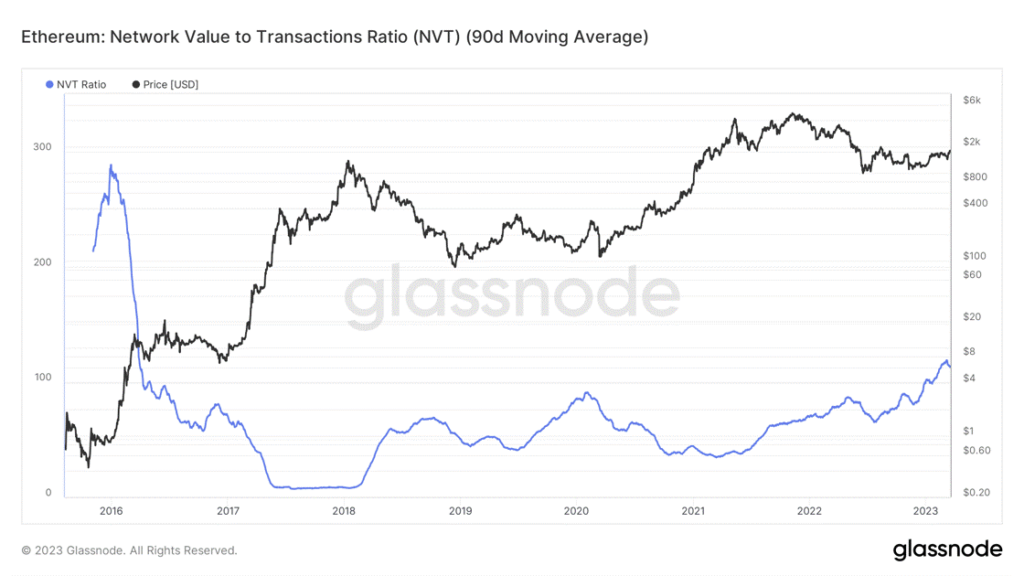
Source: Glassnode
Analogous to the price to earnings for stocks, the Network Value to Transactions (NVT) Ratio can help track the realized valuation levels of an asset. As shown in Figure 3, an NVT ratio as high as 300 indicates that Ethereum may be overvalued since the network value, or market cap, is higher than the transaction volume. Whereas downtrends like the one seen in 2017 indicate that transactions are outgrowing the network value and investors may be buying Ethereum at a discount. Although the chart above indicates that the market cap outweighs the volume of transactions on the network, historically speaking the second-largest cryptoasset by market cap is still in a healthy valuation range.
Next Week’s Calendar
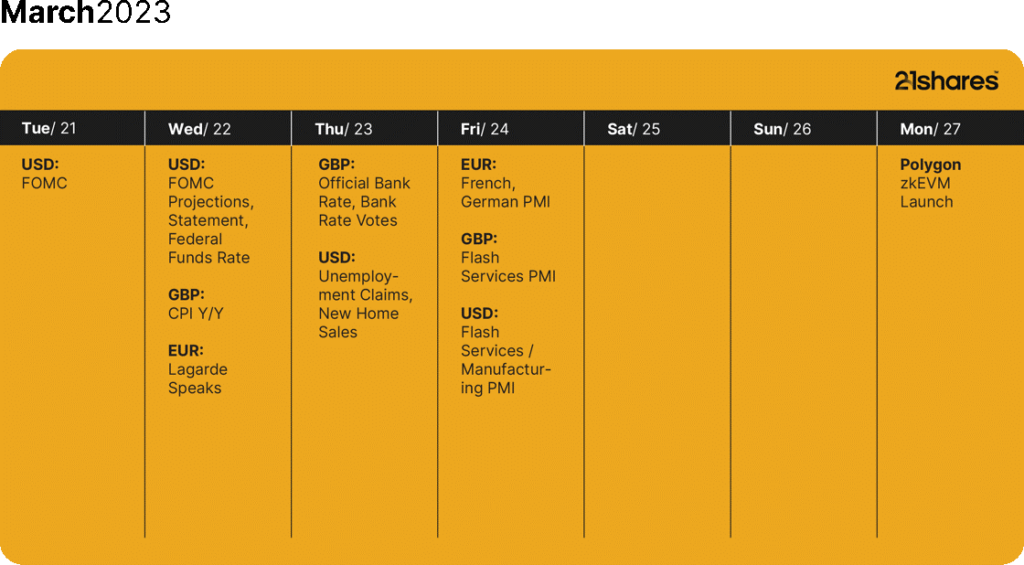
Source: Forex Factory, CoinMarketCal
Read full report here
Research Newsletter
Each week the 21Shares Research team will publish our data-driven insights into the crypto asset world through this newsletter. Please direct any comments, questions, and words of feedback to research@21shares.com
Disclaimer
The information provided does not constitute a prospectus or other offering material and does not contain or constitute an offer to sell or a solicitation of any offer to buy securities in any jurisdiction. Some of the information published herein may contain forward-looking statements. Readers are cautioned that any such forward-looking statements are not guarantees of future performance and involve risks and uncertainties and that actual results may differ materially from those in the forward-looking statements as a result of various factors. The information contained herein may not be considered as economic, legal, tax or other advice and users are cautioned to base investment decisions or other decisions solely on the content hereof.


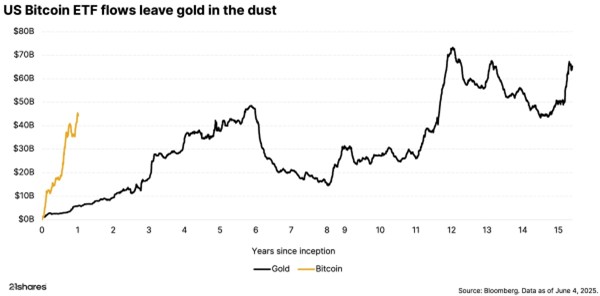
Bitcoin is now worth over $100,000, thanks to clearer regulations and growing interest from both big investors and everyday people. What began quietly in 2009 as a digital experiment has evolved into a globally recognized asset. That’s why it’s important to understand why people invest in Bitcoin.

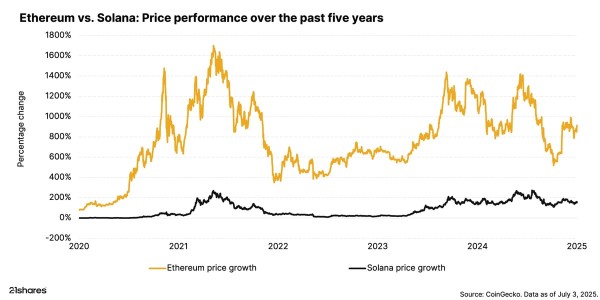
Mid-year momentum: What are Ethereum and Solana up to?
We’re halfway through 2025, and Ethereum and Solana have already made big moves. Both networks are rolling out major upgrades that could reshape how the crypto space works in the months ahead.


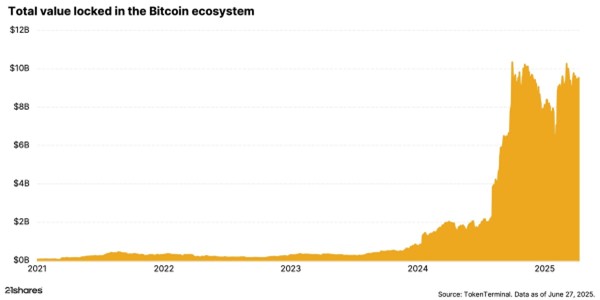
Beyond digital gold: Bitcoin enters the DeFi world
Bitcoin is often seen as a store of value, like digital gold, but hasn’t been known for doing much beyond that. That’s now changing. In 2025, a new trend called Bitcoin Finance (BTC-Fi) is gaining traction, turning Bitcoin into an active part of the broader crypto ecosystem.

Research Newsletter
Each week the 21Shares Research team will publish our data-driven insights into the crypto asset world through this newsletter. Please direct any comments, questions, and words of feedback to research@21shares.com
Disclaimer
The information provided does not constitute a prospectus or other offering material and does not contain or constitute an offer to sell or a solicitation of any offer to buy securities in any jurisdiction. Some of the information published herein may contain forward-looking statements. Readers are cautioned that any such forward-looking statements are not guarantees of future performance and involve risks and uncertainties and that actual results may differ materially from those in the forward-looking statements as a result of various factors. The information contained herein may not be considered as economic, legal, tax or other advice and users are cautioned to base investment decisions or other decisions solely on the content hereof.

Nyheter
Kryptons revansch: Därför lockar bitcoin investerare igen – så enkelt kan du få dubbel exponering

Why Bitcoin belongs in your portfolio

USB7 ETF köper amerikanska statsobligationer med löptid upp till tio år

Kryptons revansch: Därför lockar bitcoin investerare igen – så enkelt kan du få dubbel exponering

DFNC ETF ger exponering mot försvarsindustrin i Europa
Why are major institutions looking to Solana for stablecoin issuance in Europe?

De bästa ETFer som investerar i europeiska utdelningsaktier

YieldMax® lanserar sin andra produkt för europeiska investerare

Big News for Nuclear Energy—What It Means for Investors

Svenska investerare — 21Shares Nasdaq Stockholm-sortiment har just blivit starkare

3EDS ETN ger tre gånger den negativa avkastningen på flyg- och försvarsindustrin
-
 Nyheter2 veckor sedan
De bästa ETFer som investerar i europeiska utdelningsaktier
-
 Nyheter4 veckor sedan
YieldMax® lanserar sin andra produkt för europeiska investerare
-
 Nyheter4 veckor sedan
Big News for Nuclear Energy—What It Means for Investors
-
 Nyheter2 veckor sedan
Svenska investerare — 21Shares Nasdaq Stockholm-sortiment har just blivit starkare
-
 Nyheter4 veckor sedan
3EDS ETN ger tre gånger den negativa avkastningen på flyg- och försvarsindustrin
-
 Nyheter2 veckor sedan
Nordea Asset Management lanserar nya ETFer på Xetra
-
 Nyheter1 vecka sedan
12 000 artiklar om börshandlade fonder
-

 Nyheter1 vecka sedan
Hetaste investeringstemat i juni 2025