
Nyheter
Crypto Market Compass 27. May 2024
Successfully navigate through Bitcoin & Cryptoasset Markets
• Cryptoassets rallye supported by the Ethereum ETF approval in the US and strong inflows into global crypto ETPs
• Our in-house “Cryptoasset Sentiment Indicator” has increased and signals slightly above neutral levels in sentiment
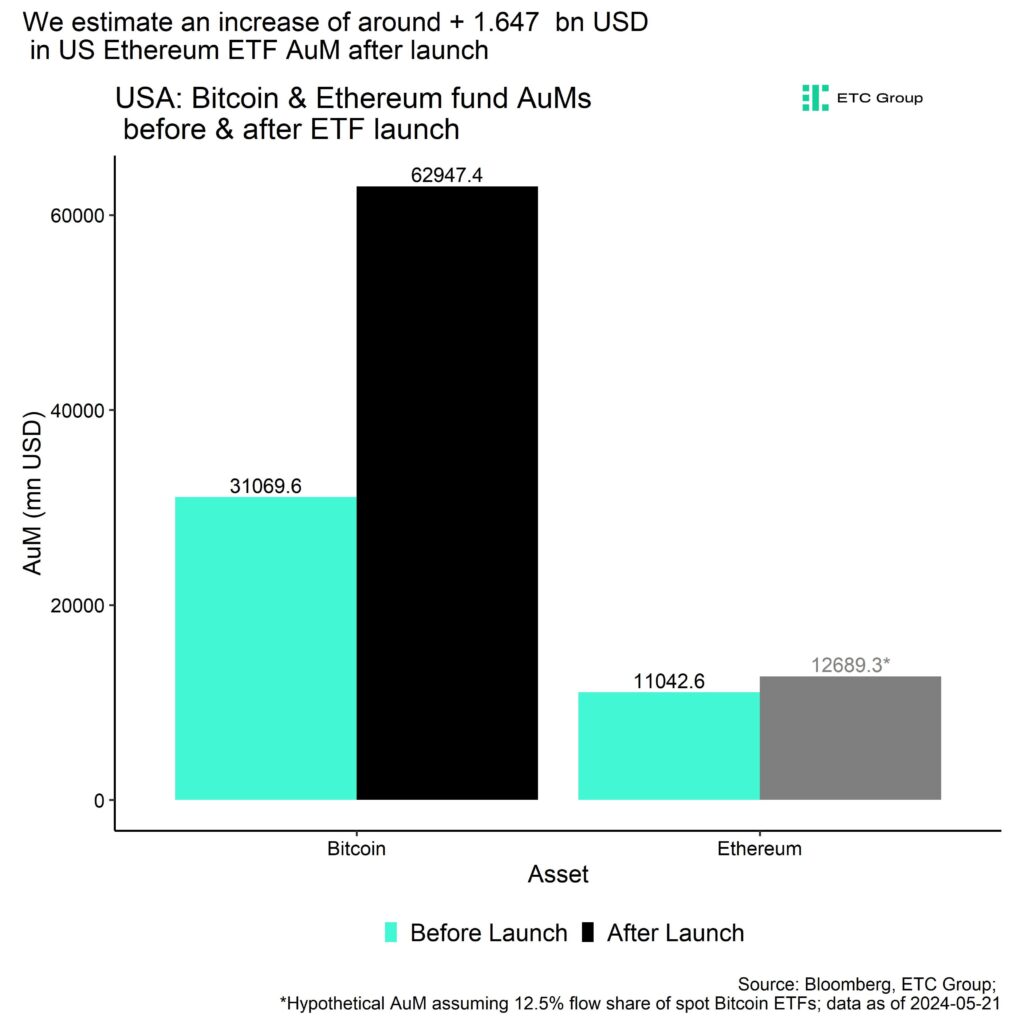
• We expect approximately 1.65 bn USD potential net inflows into US Ethereum ETFs in the first 3 months after trading launch
Chart of the Week
Performance
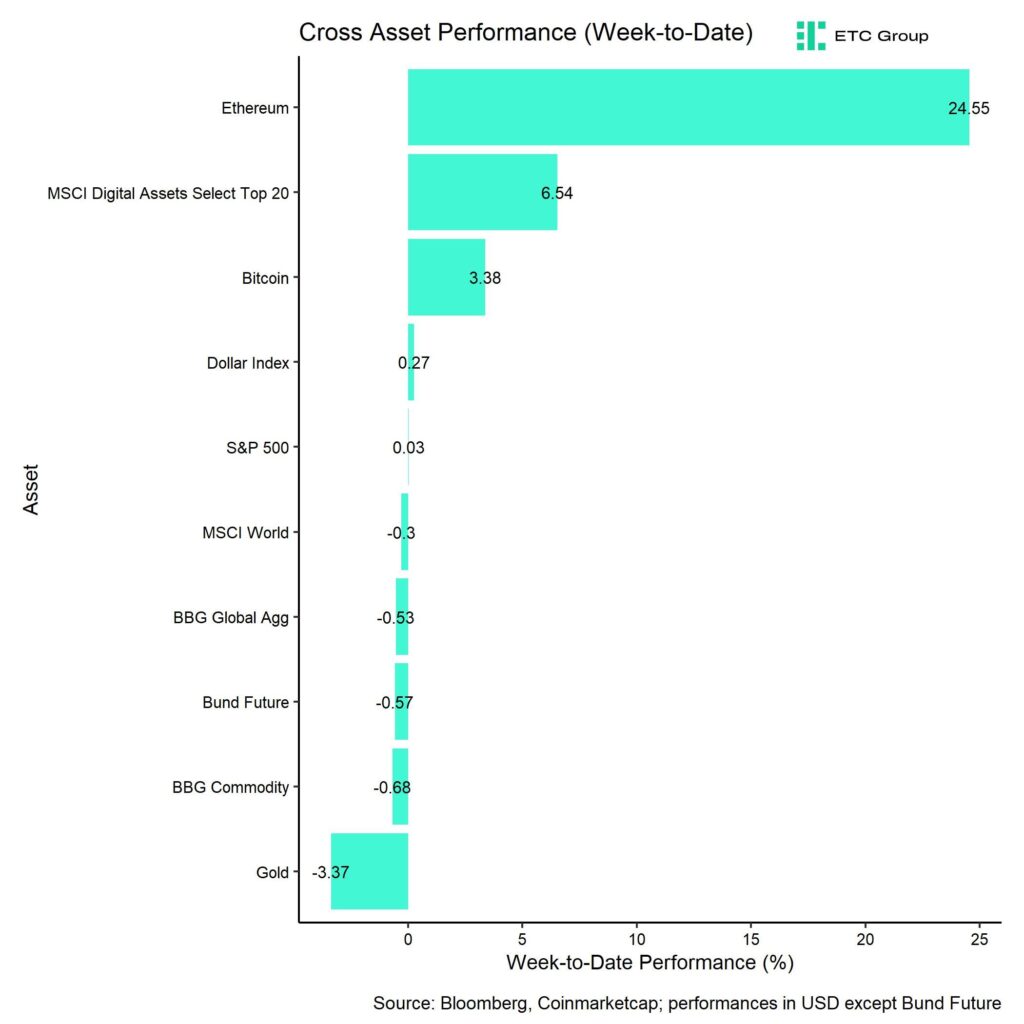
Last week, cryptoassets once again outperformed traditional assets by a very wide margin. Cryptoassets were mainly supported by strong inflows into global crypto ETPs and the final approval of spot Ethereum ETFs in the US.
Weekly net inflows into global crypto ETPs surpassed 1 bn USD last week mainly due to strong inflows into US Bitcoin ETFs while global Ethereum ETP flows were net negative.
Nonetheless, Ethereum managed to outperform Bitcoin strongly buoyed by the prospects of the Ethereum ETF approval in the US. We estimate that approximately 1.65 bn USD could flow into these new spot Ethereum ETFs in the first 3 months after the official trading launch (Chart-of-the-Week).
Although this just represents a small fraction of what has so far flown into spot Bitcoin ETFs, we expect these flows to still have a very significant influence on the performance of Ethereum.
Read more on this topic in our latest Crypto Market Espresso here.
Although the date for the official trading launch still needs to be announced, most
experts expect a trading launch within the next three months and most likely before the US presidential elections in November this year.
The important takeaway from the Ethereum ETF approval is that it marks a significant shift in sentiment within the SEC and among US regulators in general as cryptoassets have increasingly gained majority backing within the US political landscape.
The fact that the US House and Senate have approved the FIT21 Act (“crypto bill”) and that the Trump campaign has officially accepted crypto payments for campaign financing speak volumes in this regard. It seems as if no candidate and party in the US is able to run on an anti-crypto stance anymore.
The Financial Innovation and Technology for the 21st Century Act (FIT21) offers the strong consumer protections and regulatory clarity required for the ecosystem of digital assets.
By providing consumer protections and establishing the Commodity Futures Trading Commission (CFTC) as the primary regulator for digital assets and non-securities spot markets, the legislation seeks to establish a framework for regulating digital assets. This ought to offer more precise definitions for identifying cryptocurrency tokens as commodities or securities.
Despite the short-term euphoria around the Ethereum ETF approval, the market will generally lack major catalysts over the coming months.
In general, performance seasonality tends to be less supportive during the summer months and the positive effects from the Bitcoin Halving will most likely materialize later in the summer (around August onwards). The US spot Ethereum ETF trading launch is also still a couple of months away and the US presidential race will really start to heat up after the summer break.
Barring any buying announcement from a major sovereign or corporation, we still expect that increasing US recession risks could turn out to be a headwind for Bitcoin and cryptoassets in the short-term.
However, given the positive prospects towards the end of the year, any short-term price weakness should be viewed as an opportunity to increase exposure.
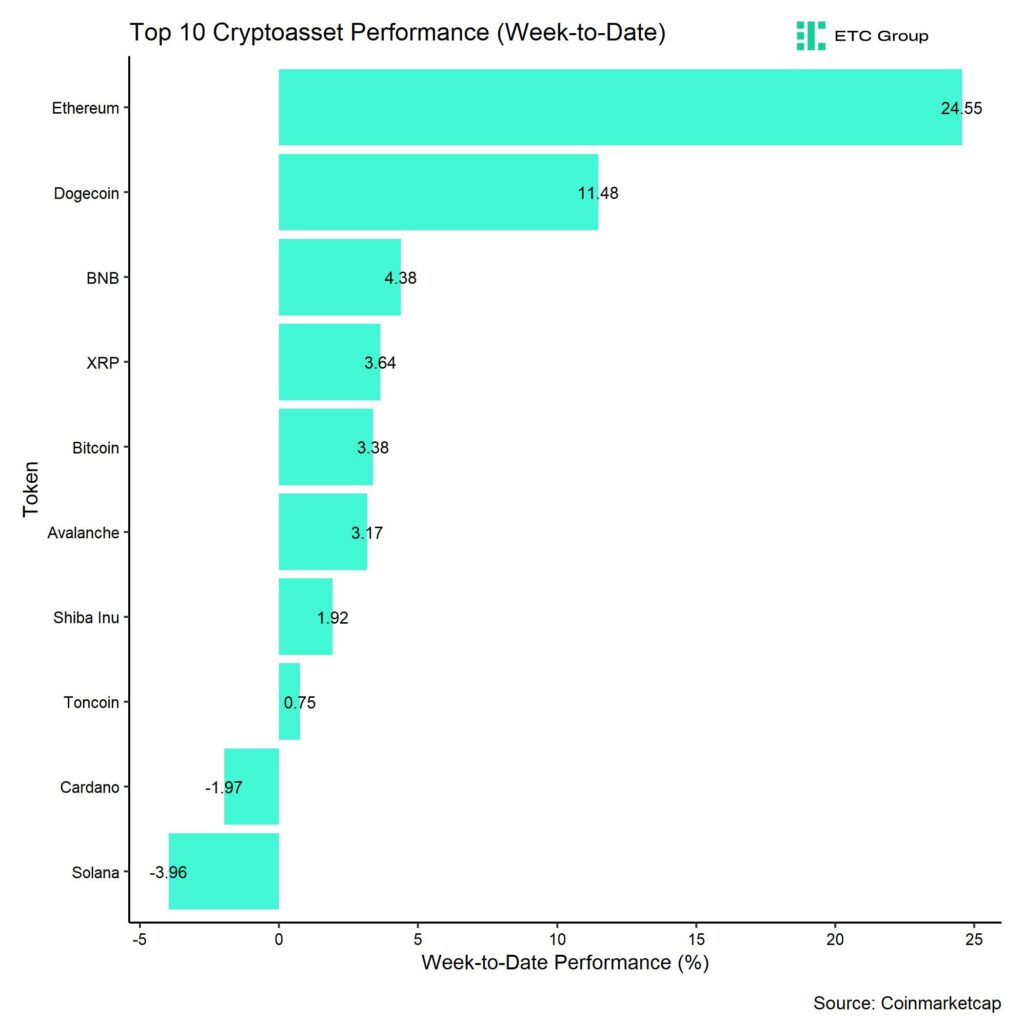
In general, among the top 10 crypto assets, Ethereum, Dogecoin, and BNB were the relative outperformers.
However, overall altcoin outperformance vis-à-vis Bitcoin has started to pick up, with around 60% of our tracked altcoins managing to outperform Bitcoin on a weekly basis.
Sentiment
Our in-house “Cryptoasset Sentiment Index” has increased last week is currently signalling sentiment which is slightly above neutral levels.
At the moment, 8 out of 15 indicators are above their short-term trend.
Last week, there were significant reversals to the upside in our altseason index and Crypto Fear & Greed Index.
The Crypto Fear & Greed Index signals ”Greed” as of this morning.
Performance dispersion among cryptoassets has started to increase, albeit from low levels. Most altcoins remain highly correlated with Bitcoin.
Altcoin outperformance vis-à-vis Bitcoin has picked up following the latest development around the Ethereum ETF approval, with around 60% of our tracked altcoins outperforming Bitcoin on a weekly basis. Altcoin outperformance was generally buoyed by a very significant outperformance of Ethereum vis-à-vis Bitcoin last week.
In general, increasing (decreasing) altcoin outperformance tends to be a sign of increasing (decreasing) risk appetite within cryptoasset markets.
Meanwhile, sentiment in traditional financial markets still remains elevated, judging by our own measure of Cross Asset Risk Appetite (CARA).
Fund Flows
Last week, we saw another week of very positive net inflows into global crypto ETPs with around +1,011.1 mn USD in net inflows across all types of cryptoassets (week ending Friday).
Global Bitcoin ETPs saw net inflows of +1,030.8 mn USD last week of which +1,060.6 mn USD (net) were related to US spot Bitcoin ETFs alone.
Flows into Hong Kong spot Bitcoin ETFs reversed last week with net inflows of around +35.5 mn USD, according to data provided by Bloomberg.
The ETC Group Physical Bitcoin ETP (BTCE) also saw significant net inflows equivalent to +14.6 mn USD while the ETC Group Core Bitcoin ETP (BTC1) saw net inflows of +0.1 mn USD last week.
The Grayscale Bitcoin Trust (GBTC) saw a return of negative net flows with approximately -20.5 mn USD last week while other major US spot Bitcoin ETFs continued to attract new capital, e.g. iShares’ IBIT took in a whopping +719.3 mn USD in a single week.
Despite the Ethereum ETF approval in the US, Global Ethereum ETPs continued to see declining ETP flows last week, with net outflows of around -18.0 mn USD.
Hong Kong spot Ethereum ETFs that saw minor net inflows last week of around +2.1 mn USD, according to data provided by Bloomberg.
Furthermore, the ETC Group Physical Ethereum ETP (ZETH) saw significant net inflows of +13.9 mn USD last week. The ETC Group Ethereum Staking ETP (ET32) also managed to attract capital in the order of +3.9 mn USD.
Besides, Altcoin ETPs ex Ethereum experienced some net inflows of around +14.1 mn USD last week.
Besides, Thematic & basket crypto ETPs continued to see minor net outflows of -15.8 mn USD, based on our calculations. In contrast, the ETC Group MSCI Digital Assets Select 20 ETP (DA20) managed to attract some net inflows last week (+0.3 mn USD).
Meanwhile, the beta of global crypto hedge funds to Bitcoin over the last 20 trading days has started to reverse and decreased to around 0.9. This implies that global crypto hedge funds have started to reduce their market exposure into last week and have currently a slightly less than neutral exposure to Bitcoin.
On-Chain Data
Bitcoin on-chain data remain lukewarm.
Overall net buying minus selling volumes on spot exchanges have been negative over the past week.
So, despite strong inflows into global Bitcoin ETPs and US spot Bitcoin ETFs in particular, spot exchanges continue to see an overhang of selling volumes.
In fact, overall net transfers to exchanges were positive over the past amid significant whale transfers to exchanges. Whales are defined as network entities that control at least 1,000 BTC.
Net transfers to exchanges generally imply increasing selling pressure.
This is generally a negative sign. It seems as if whales are “selling into strength”.
Last week saw the highest weekly net whale transfers of BTC to exchanges year-to-date. This is one of the reasons why we saw a slight increase in BTC exchange balances as well.
Ethereum exchange balances remained relatively flat over the past week with only a temporary drawdown in ETH balances following the pick-up in approval odds at the beginning of last week. However, Ethereum exchange balances are still slightly higher than in April.
In general, there was a slight pick-up in profit-taking by BTC investors as well which was significantly lower than during the all-time highs made in March though.
The market remains overall in a profit environment, i.e. both long- and short-term BTC holders have unrealized profits on aggregate. Short-term holders have recently also spent coins in profit on average.
Futures, Options & Perpetuals
Last week, both BTC futures and perpetual open interest saw a slight significant increase in BTC-terms which seems to be related to a net increase in long open interest. This was most likely associated with a net increase in short open interest.
We only saw a minor increase in BTC short futures liquidations following the turnaround in Ethereum ETF approval odds at the beginning of last week. ETH short futures liquidations spiked to the highest level since mid-April last week.
The Bitcoin futures basis remained relatively flat last week. At the time of writing, the Bitcoin futures annualized basis rate stands at around 12.7% p.a. Perpetual funding rates continued to stay relatively elevated signalling decent demand for long
perpetual contracts.
Bitcoin options’ open interest increased significantly last week as BTC option traders seem to have increased their net long exposure via calls. Relative put-call volume ratios remained below 1.0 last week meaning that relatively more calls than puts were traded.
However, the 25-delta BTC 1-month option skew increased throughout the week, implying an increased demand for puts relative to calls.
BTC option implied volatilities decreased slightly last week. Implied volatilities of 1-month ATM Bitcoin options are currently at around 52% p.a.
Ethereum’s 1-month implied volatilities also declined compared to beginning of last week as the term structure of volatility also normalized. Implied volatilities for Ethereum options expiring last Friday had increased to 140%. Now, Ethereum ATM options expiring this Friday (31st of May) only price around 64% in implied volatility.
Bottom Line
• Cryptoassets rallye supported by the Ethereum ETF approval in the US and strong inflows into global crypto ETPs
• Our in-house “Cryptoasset Sentiment Indicator” has increased and signals slightly above neutral levels in sentiment
• We expect approximately 1.65 bn USD potential net inflows into US Ethereum ETFs in the first 3 months after trading launch
To read our Crypto Market Compass in full, please click the button below:

This is not investment advice. Capital at risk. Read the full disclaimer
© ETC Group 2019-2024 | All rights reserved


Nyheter
HANetf blir den största ETF-utgivaren på Warszawabörsen, med 8 nya UCITS ETF-noteringar och fler på gång


Defiance utökar sitt europeiska utbud med lanseringen av Europas första minnes-ETF

KBOT ETF investerar i humanoida robotar

HANetf blir den största ETF-utgivaren på Warszawabörsen, med 8 nya UCITS ETF-noteringar och fler på gång

ASWA ETF ger exponering mot kärnbränsle- och energiindustrin

Nya ETF- och ETP-noteringar den 19 juni 2026 på Deutsche Börse

USA satsar 2 miljarder dollar på kvantdatorer – så kan investerare dra nytta av utvecklingen

Extrema skillnader: Varför presterar Europas kvantdator-ETFer så olika?

QQCC ETF följer företag världen över som är aktiva inom kvantberäkning

Fastställd utdelning i MONTDIV maj 2026

Varför Plus500 är en dröm för finans-affiliate
-
 Nyheter4 veckor sedan
USA satsar 2 miljarder dollar på kvantdatorer – så kan investerare dra nytta av utvecklingen
-
 Nyheter2 veckor sedan
Extrema skillnader: Varför presterar Europas kvantdator-ETFer så olika?
-
 Nyheter3 veckor sedan
QQCC ETF följer företag världen över som är aktiva inom kvantberäkning
-
 Nyheter4 veckor sedan
Fastställd utdelning i MONTDIV maj 2026
-
 Nyheter3 veckor sedan
Varför Plus500 är en dröm för finans-affiliate
-

 Nyheter3 veckor sedan
ETFer för fotbolls-VM 2026
-

 Nyheter3 veckor sedan
21shares produkter nu finns tillgängliga hos Revolut
-

 Nyheter6 dagar sedan
Den osynliga flaskhalsen i AI-boomen: Varför elinfrastruktur är nästa stora megatrend