
Nyheter
Crypto Market Compass | 13. May 2024
• Bitcoin continues to consolidate above 60k USD as the market is gradually entering dull seasonality from June onwards
• Our in-house “Cryptoasset Sentiment Indicator” continues to hover around neutral levels in sentiment
• Unprofitable BTC miners are coming under pressure following the Halving judging by the recent decline in network hash rate
Chart of the Week
Performance

Last week, cryptoassets underperformed traditional financial assets like equities or Gold as Bitcoin continued to consolidate above 60k USD.
It appears as if the market is currently lacking new positive catalysts after the US and Hong Kong spot ETF approvals and the Bitcoin Halving. Moreover, we are gradually entering dull seasonality from June onwards as the summer months have historically shown below-average returns for Bitcoin in the past.
Moreover, increasing US recession risks towards the summer as outlined in our latest monthly report could provide a temporary headwind for Bitcoin and cryptoassets as our own analyses still imply that Bitcoin’s performance continues to be dominated by global growth expectations.
Our base case is that the market continues to consolidate until macro risks have cleared/materialized and the positive performance effects from the Halving start to kick in around August 2024 as outlined in our special report about the Halving.
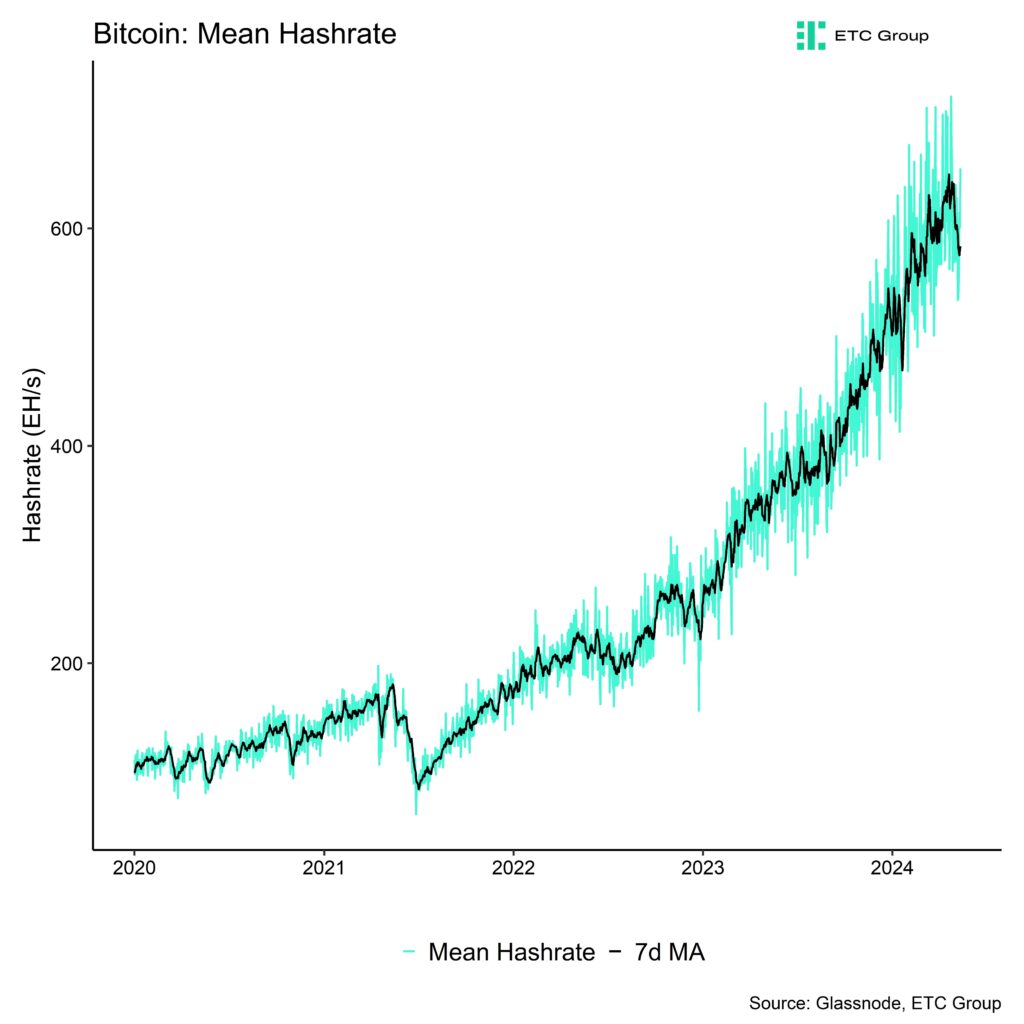
In the meantime, unprofitable BTC miners could come under pressure and there seems to be first evidence of that happening judging by the recent decline in network hash rate (Chart-of-the-Week). More specifically, the 7-day moving average of
Bitcoin’s hash rate has already declined by around -8% since the Halving took place on the 20 th of April.
In addition, last week also saw the 4th negative difficulty adjustment this year as it took BTC miners on average longer than 10 minutes to find the correct hash for a block. This is additional evidence that the network hash rate has been reduced.
In fact, the average BTC miner’s revenue has declined significantly as both the block subsidy and transaction fees have declined significantly since the Halving. Daily aggregate miner revenues have dropped to around ~28 mn USD, down from ~72 mn USD at the time of the Halving. That being said, there is no sign of significant distribution of bitcoins by BTC miners yet based on aggregate BTC miner balances.
There have been no significant transfers from miner wallets to exchange wallets either more recently.
Increasing selling pressure by BTC miners could be a headwind in the short term.
Furthermore, selling pressure could also materialize via fund outflows from crypto ETPs as traditional investors could distribute some of their crypto holdings for liquidity reasons in case of increasing US recession risks mentioned above.
This is something that we will continue to monitor over the coming weeks.
On a positive note, overall exchange inflows that are usually a good barometer for overall selling pressure have abated more recently and neither short- nor long-term holders are currently distributing coins in a significant way. Besides, global crypto ETPs still saw net inflows overall over the past week despite ongoing GBTC outflows in the US.
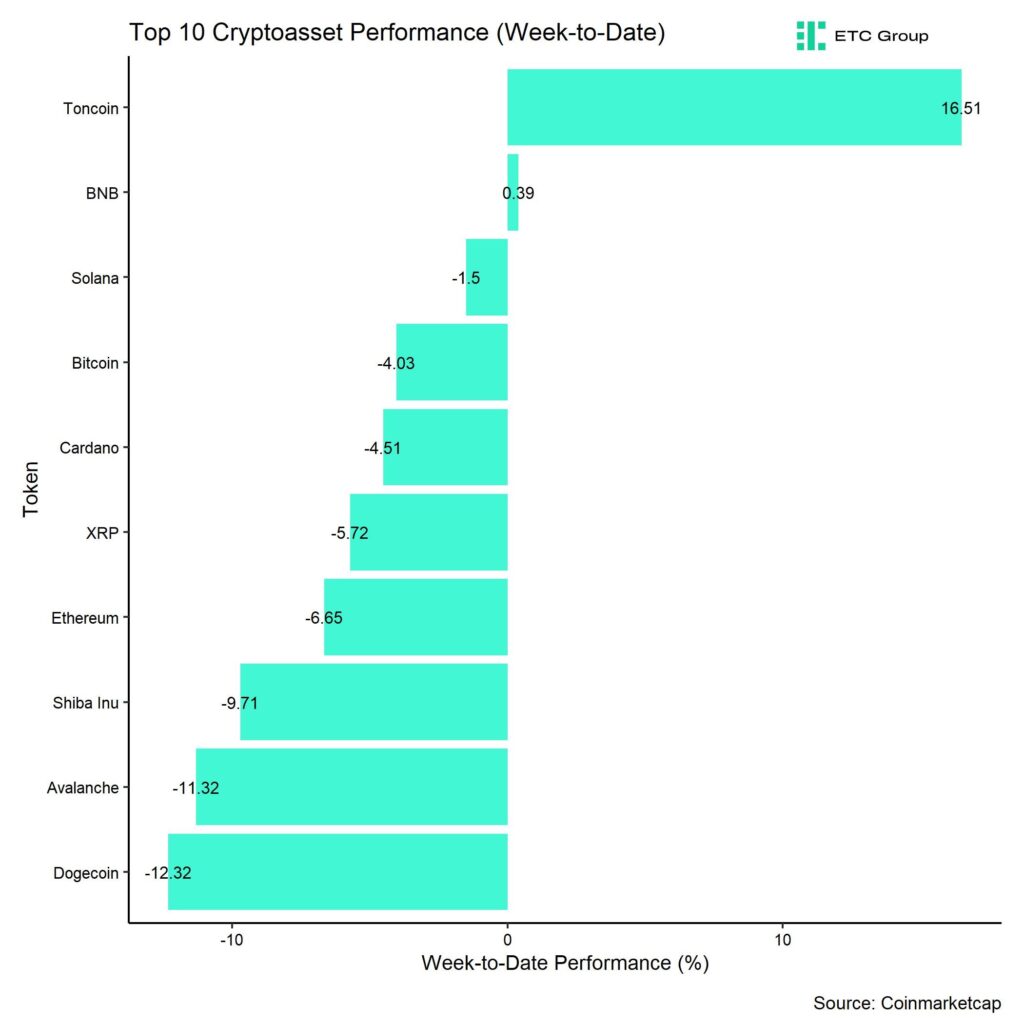
In general, among the top 10 crypto assets, Toncoin, BNB, and Solana were the relative outperformers.
However, overall altcoin outperformance vis-à-vis Bitcoin remained relatively low, with only around 40% of our tracked altcoins managing to outperform Bitcoin on a weekly basis.
Sentiment
Our in-house “Cryptoasset Sentiment Index” continues to hover around neutral levels in sentiment. The more recent correction has only led to a slight decrease in sentiment so far.
At the moment, 5 out of 15 indicators are above their short-term trend.
Last week, there were significant reversals to the downside in global crypto ETP fund flows and the Crypto Fear & Greed Index.
That being said, the Crypto Fear & Greed Index still signals ”Greed” again as of this morning.
Performance dispersion among cryptoassets has continued to remain low.
Altcoin outperformance vis-à-vis Bitcoin was still subdued, with around 40% of our tracked altcoins that have outperformed Bitcoin on a weekly basis. At the same time, Ethereum continued to underperform Bitcoin last week.
In general, increasing (decreasing) altcoin outperformance tends to be a sign of increasing (decreasing) risk appetite within cryptoasset markets.
Meanwhile, sentiment in traditional financial markets remains relatively elevated, judging by our own measure of Cross Asset Risk Appetite (CARA).
Fund Flows
Last week, we saw a slight reversal in global crypto ETPs with around +25.7 mn USD in net inflows, up from around -372.4 mn USD the week prior based on Bloomberg data.
Global Bitcoin ETPs saw net inflows of +92.5 mn USD of which +117.0 mn (net) were related to US spot Bitcoin ETFs alone. Hong Kong spot Bitcoin ETFs already experienced net outflows of around -40.9 mn USD last week according to data provided by Bloomberg.
The ETC Group Physical Bitcoin ETP (BTCE) also saw net outflows equivalent to -33.4 mn USD while the ETC Group Core Bitcoin ETP (BTC1) saw minor net inflows of +0.7 mn USD last week.
The Grayscale Bitcoin Trust (GBTC) continued to experience net outflows of approximately -171.1 mn USD last week while other major US spot Bitcoin ETFs were able to attract new capital, e.g. iShares’ IBIT with net inflows of around +48.2 mn USD.
In contrast to Bitcoin ETPs, Global Ethereum ETPs saw a decline in ETP flows last week, with net outflows of around -63.5 mn USD. This was mostly due to significant outflows from Hong Kong spot Ethereum ETFs that saw -46.5 mn USD in net outflows last week, according to data provided by Bloomberg.
In general, there seems to be an emerging pattern in crypto ETP fund flows that while global Bitcoin ETP flows continue to be dominated by US spot Bitcoin ETF flows, global Ethereum ETP fund flows are increasingly dominated by Hong Kong spot Ethereum ETF flows.
Meanwhile, the ETC Group Physical Ethereum ETP (ZETH) saw neither in- nor outflows (+/- 0 mn USD). The ETC Group Ethereum Staking ETP (ET32) experienced some net outflows (-1.5 mn USD) last week.
Besides, Altcoin ETPs ex Ethereum experienced only minor net inflows of around +5.7 mn USD last week.
Besides, Thematic & basket crypto ETPs experienced some net outflows of -9.0 mn USD, based on our calculations. The ETC Group MSCI Digital Assets Select 20 ETP (DA20) did experience neither in- nor outflows last week (+/- 0 mn USD).
Besides, the beta of global crypto hedge funds to Bitcoin over the last 20 trading days continued to increase to around 1.06. This implies that global crypto hedge funds have significantly increased their market exposure and have currently a slightly more than neutral exposure to Bitcoin.
On-Chain Data
As the market has rebounded from oversold levels at the beginning of May, on-chain data for Bitcoin remain somewhat mixed.
As mentioned above, unprofitable BTC miners could come under pressure and there seems to be first evidence of that happening judging by the recent decline in network hash rate (Chart-of-the-Week).
More specifically, the 7-day moving average of Bitcoin’s hash rate has already declined by around -8% since the Halving took place on the 20th of April.
In this context, the decline in active addresses to year-to-date lows appears to be somewhat concerning. On a positive note, overall network activity based on a variety of metrics still implies that Bitcoin’s network activity is still near all-time highs as the transaction count remains relatively high. This is not related to high inscription demand but related to genuine transaction demand.
Coming to Bitcoin’s hash rate, last week also saw the 4th negative difficulty adjustment this year as it took BTC miners on average longer than 10 minutes to find the correct hash for a block. This is additional evidence that the network hash rate has been reduced.
In fact, the average BTC miner’s revenue has declined significantly as both the block subsidy and transaction fees have declined significantly since the Halving. Daily aggregate miner revenues have dropped to around ~28 mn USD, down from ~72 mn USD at the time of the Halving.
That being said, there is no sign of significant distribution of bitcoins by BTC miners yet based on aggregate BTC miner balances. There have been no significant transfers from miner wallets to exchange wallets either more recently.
Increasing selling pressure by BTC miners could be a headwind in the short term.
Meanwhile, the increase in accumulation activity observed last week has started to decelerate a bit but is still comparatively high. Furthermore, whales continue to take coins off exchange on a net basis.
However, intraday net buying minus selling volumes on spot Bitcoin exchanges remained negative over the past week largely due to the deceleration in US spot Bitcoin ETF net inflows since March.
A renewed improvement in net buying volumes on spot exchanges is highly dependent on a resumption of higher flows into US and global Bitcoin ETP flows.
Futures, Options & Perpetuals
Last week, both BTC futures and perpetual open interest saw a slight increase in BTC-terms which seems to be related to a net increase in short open interest. In other words, BTC futures traders have started building up more downside exposure over the past week.
Meanwhile, both BTC short and long futures liquidations remained relatively low last week. The Bitcoin futures basis continued to move sideways last week. At the time of writing, the Bitcoin futures annualized basis rate stands at around 8.7% p.a.
Perpetual funding rates also remained slightly positive throughout the week.
Bitcoin options’ open interest decreased slightly last week as BTC option traders seem to have reduced their exposure of puts relative to calls. Relative put-call volume ratios remained well behaved last week.
However, the 25-delta BTC 1-month option skew increased slightly implying an increased demand for puts relative to calls.
BTC option implied volatilities have decreased slightly compared to the prior week. Implied volatilities of 1-month ATM Bitcoin options are currently at around 51.9% p.a., down from 53.1% p.a. the week prior.
Bottom Line
• Bitcoin continues to consolidate above 60k USD as the market is gradually entering dull seasonality from June onwards
• Our in-house “Cryptoasset Sentiment Indicator” continues to hover around neutral levels in sentiment
• Unprofitable BTC miners are coming under pressure following the Halving judging by the recent decline in network hash rate
To read our Crypto Market Compass in full, please click the button below:

This is not investment advice. Capital at risk. Read the full disclaimer
© ETC Group 2019-2024 | All rights reserved


DYDX ETP spårar kryptovalutan DYDX
Investera i NEAR med en börshandlad produkt

XDRE ETF satsar på gröna fastigheter

YSLV ETP ställer ut köpoptioner på silver för att skapa en löpande avkastning

IVCS ETF ger exponering mot företag som arbetar med cybersäkerhet

Utdelningar och försvarsfonder lockade i augusti

Månadsutdelande ETFer uppdaterad med IncomeShares produkter

HANetfs analyserar hur ett fredsavtal kan påverka det europeiska försvaret

HANetfs VD kommenterar Trump-Putin-toppmötet

ADLT ETF investerar bara i riktigt långa amerikanska statsobligationer
-
 Nyheter2 veckor sedan
Utdelningar och försvarsfonder lockade i augusti
-
 Nyheter3 veckor sedan
Månadsutdelande ETFer uppdaterad med IncomeShares produkter
-
 Nyheter3 veckor sedan
HANetfs analyserar hur ett fredsavtal kan påverka det europeiska försvaret
-
 Nyheter4 veckor sedan
HANetfs VD kommenterar Trump-Putin-toppmötet
-
 Nyheter3 veckor sedan
ADLT ETF investerar bara i riktigt långa amerikanska statsobligationer
-

 Nyheter2 veckor sedan
Septembers utdelning i XACT Norden Högutdelande
-

 Nyheter3 veckor sedan
Fastställd utdelning i MONTDIV augusti 2025
-

 Nyheter2 veckor sedan
HANetf kommenterar mötet mellan Kina, Ryssland och Nordkorea vid militärparad