
Nyheter
Bitcoin ETFs set the stage
The approval of spot bitcoin ETFs in the US this month might prove to be the most consequential moment for the mainstream adoption of crypto assets.
This will take months and years to play out, but in the near term there is a lot for crypto investors to be excited about. Most notable is the upcoming Bitcoin halving, set for the end of April. This event, which we discuss in detail in our 2024 Crypto Investment Outlook, has historically proven to be very positive for prices.
Regardless of where prices go in the short term, our long-term investment case for crypto has never been stronger. In his latest Notes from the CIO, Samir Kerbage looks at the investment case for bitcoin specifically in the wake of the ETF approvals and the forthcoming halving.
It’s sure to be an exciting year. As always, we are greatly appreciative of your trust in us and are here to answer any questions you may have.
-Your Partners at Hashdex
Market Review
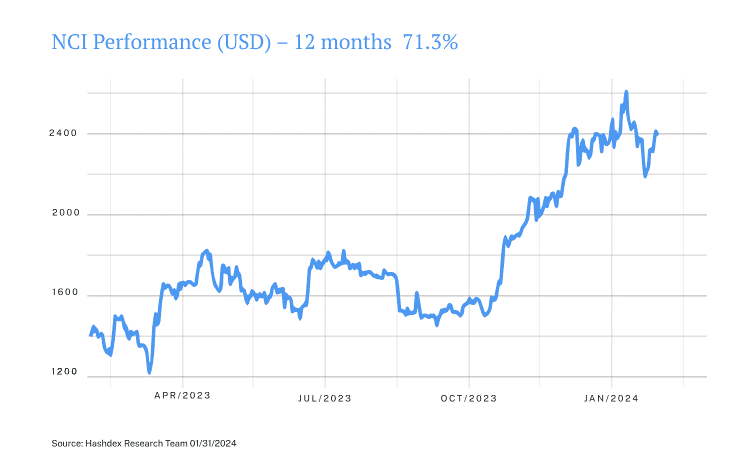
The new year started in the same manner as 2023 ended. In the early days of January, the crypto asset market surged, driven by the anticipation of the launch of spot bitcoin ETFs in the US. On the ETF debut day, the 11th, the Nasdaq Crypto Index (NCI) had accumulated a gain of over 10%, reaching a 21-month high.
However, following the ETF launches there was a reversal in this trend for technical reasons, which is worth delving into. GBTC was a bitcoin trust that did not allow redemptions, holding nearly $30 billion in bitcoins accumulated over more than a decade. Investors could only sell their shares in the secondary market, where, in recent years, there were significant discounts compared to the fair value of the shares. With the increased likelihood of a trust-to-ETF conversion, which would allow redemptions, many traders started buying shares at a discount. GBTC’s conversion to an ETF, approved alongside the new bitcoin ETFs, led to a surge in redemptions, both from traders closing their positions and from investors who had been stuck in the position for a long time. The result was that, despite significant inflows observed in other ETFs, the overall net result in the initial days was a substantial outflow of capital, leading to the sale of bitcoins and pushing the price down.
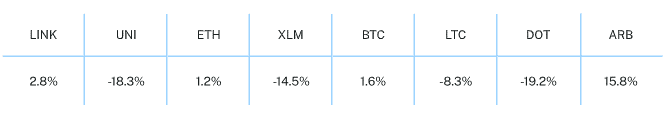
Between the 11th and the 23rd, both the NCI and bitcoin fell approximately 16%. However, during this period, redemptions in GBTC decreased, while investments in other ETFs were more resilient, causing the net flow to turn positive, meaning an influx of capital. This contributed to the recovery observed in the last eight days of the month, during which the NCI rose 9.3%, closing the month with a 1.4% increase. It marked the fifth consecutive month of growth. Similar to December, the standout performer among the index constituents was Arbitrum, with a gain of 15.8%.
For other indices serving as benchmarks for Hashdex products, the month resulted in losses due to the poor performance of most altcoins. Among the sectoral indices from CF Benchmarks, Smart Contracts Platforms, Decentralized Finance, and Digital Culture experienced declines of 7.2%, 8.3%, and 11.4%, respectively. The Vinter Hashdex Risk Parity Momentum Index lost 8.1%.
It was a positive start to the year for NCI and major crypto assets. The impact of bitcoin ETFs in the US will be felt over the coming months and years, as capital is allocated. We remain very optimistic about the prospects for the crypto asset class for this year and beyond.
Top Stories
Bitcoin mining sustainable energy usage hits all-time high of 54.5%
According to the Bitcoin ESG Forecast, bitcoin mining has reached a historical peak of 54.5% utilization of sustainable energy, marking a 3.6% overall increase in sustainable mining throughout 2023. According to the data, bitcoin mining currently stands as the foremost consumer of sustainable energy compared to other global industries.
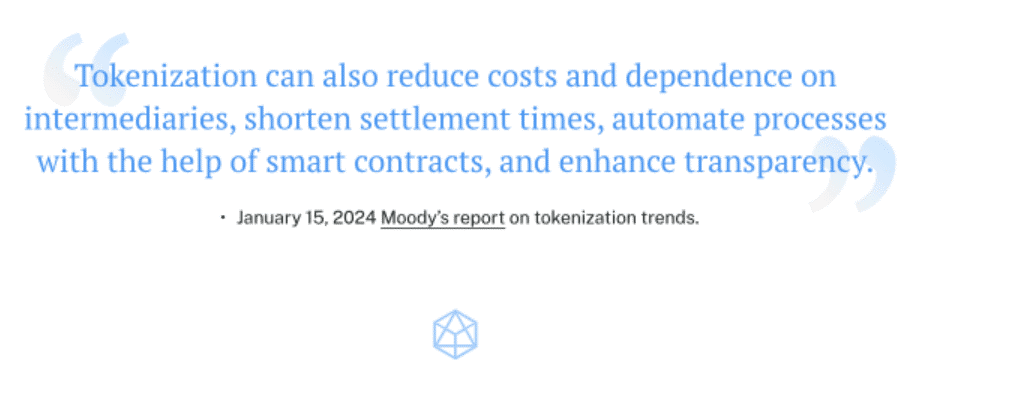
BlackRock and Moody’s endorse tokenization
BlackRock CEO Larry Fink asserted that ”Bitcoin surpasses any government” and is a potential long-term store of value, particularly in countries where citizens fear their government’s actions or currency devaluation. Fink also highlighted the significance of crypto ETFs on CNBC, envisioning a future where assets are increasingly tokenized. His comments came out not long before credit rating giant Moody’s released their own report highlighting the benefits of tokenization.
Bullish sentiment shifts to Ethereum
Ether (ETH) experienced a pretty significant bullish reversal on its BTC pair early in the month. This move suggests that market participants have started rotating capital to the second largest crypto asset after more than a year of underperformance against BTC, in what could be explained by a narrative shift from spot BTC ETFs to potential spot ETH ETFs coming later in 2024.
This material expresses Hashdex Asset Management Ltd. and its subsidiaries and affiliates (“Hashdex”)’s opinion for informational purposes only and does not consider the investment objectives, financial situation or individual needs of one or a particular group of investors. We recommend consulting specialized professionals for investment decisions. Investors are advised to carefully read the prospectus or regulations before investing their funds. The information and conclusions contained in this material may be changed at any time, without prior notice. Nothing contained herein constitutes an offer, solicitation or recommendation regarding any investment management product or service. This information is not directed at or intended for distribution to or use by any person or entity located in any jurisdiction where such distribution, publication, availability or use would be contrary to applicable law or regulation or which would subject Hashdex to any registration or licensing requirements within such jurisdiction. No part of this material may be (i) copied, photocopied or duplicated in any form by any means or (ii) redistributed without the prior written consent of Hashdex. By receiving or reviewing this material, you agree that this material is confidential intellectual property of Hashdex and that you will not directly or indirectly copy, modify, recast, publish or redistribute this material and the information therein, in whole or in part, or otherwise make any commercial use of this material without Hashdex’s prior written consent.
Investment in any investment vehicle and cryptoassets is highly speculative and is not intended as a complete investment program. It is designed only for sophisticated persons who can bear the economic risk of the loss of their entire investment and who have limited need for liquidity in their investment. There can be no assurance that the investment vehicles will achieve its investment objective or return any capital. No guarantee or representation is made that Hashdex’s investment strategy, including, without limitation, its business and investment objectives, diversification strategies or risk monitoring goals, will be successful, and investment results may vary substantially over time. Nothing herein is intended to imply that the Hashdex s investment methodology or that investing any of the protocols or tokens listed in the Information may be considered “conservative,” “safe,” “risk free,” or “risk averse.”
Certain information contained herein (including financial information) has been obtained from published and non-published sources. Such information has not been independently verified by Hashdex, and Hashdex does not assume responsibility for the accuracy of such information. Hashdex does not provide tax, accounting or legal advice. Certain information contained herein constitutes forward-looking statements, which can be identified by the use of terms such as “may,” “will,” “should,” “expect,” “anticipate,” “project,” “estimate,” “intend,” “continue” “believe” (or the negatives thereof) or other variations thereof. Due to various risks and uncertainties, including those discussed above, actual events or results, the ultimate business or activities of Hashdex and its investment vehicles or the actual performance of Hashdex, its investment vehicles, or digital tokens may differ materially from those reflected or contemplated in such forward-looking statements. As a result, investors should not rely on such forward- looking statements in making their investment decisions. None of the information contained herein has been filed with the U.S. Securities and Exchange Commission or any other governmental or self-regulatory authority. No governmental authority has opined on the merits of Hashdex’s investment vehicles or the adequacy of the information contained herein.
Nasdaq®, Nasdaq Crypto IndexTM, NCITM, Nasdaq Crypto Index EuropeTM, NCIETM are registered trademarks of Nasdaq, Inc. (which with its affiliates is referred to as the “Corporations”) and are licensed for use by Hashdex Asset Management Ltd. The Hashdex Nasdaq Crypto Index Europe ETP (the Product) have not been passed on by the Corporations as to their legality or suitability. The Product is not issued, endorsed, sold, or promoted by the Corporations. THE CORPORATIONS MAKE NO WARRANTIES AND BEAR NO LIABILITY WITH RESPECT TO THE PRODUCT.


HEQD ETF investerar i aktier som handlas på Nasdaq

MNTE ETF är en buffert-ETF som spårar amerikanska storbolag

Vilken typ av sektor ETFer finns det?

LVLD ETF investerar i ett urval av företag världen över med låg volatilitet

Den europeiska ETF-revolutionen: Skiftet som ritar om kartan för kapitalförvaltning

USA satsar 2 miljarder dollar på kvantdatorer – så kan investerare dra nytta av utvecklingen

Extrema skillnader: Varför presterar Europas kvantdator-ETFer så olika?

QQCC ETF följer företag världen över som är aktiva inom kvantberäkning

Varför Plus500 är en dröm för finans-affiliate

Den osynliga flaskhalsen i AI-boomen: Varför elinfrastruktur är nästa stora megatrend
-
 Nyheter4 veckor sedan
USA satsar 2 miljarder dollar på kvantdatorer – så kan investerare dra nytta av utvecklingen
-
 Nyheter3 veckor sedan
Extrema skillnader: Varför presterar Europas kvantdator-ETFer så olika?
-
 Nyheter3 veckor sedan
QQCC ETF följer företag världen över som är aktiva inom kvantberäkning
-
 Nyheter3 veckor sedan
Varför Plus500 är en dröm för finans-affiliate
-
 Nyheter1 vecka sedan
Den osynliga flaskhalsen i AI-boomen: Varför elinfrastruktur är nästa stora megatrend
-

 Nyheter3 veckor sedan
ETFer för fotbolls-VM 2026
-

 Nyheter4 veckor sedan
21shares produkter nu finns tillgängliga hos Revolut
-

 Nyheter3 veckor sedan
Olja och Hormuzsundet fick flest sökningar i maj 2026