
Nyheter
30 år efter Black Monday


Markets are moving fast and keeping up with what this means for your portfolio can be tough. VanEck’s Asset Allocation Committee recently gave an update on market trends and shared how these factors are shaping our core allocation models, the VanEck Wealth Builder Portfolios.
Watch the Webinar Replay Here
Key Highlights
• Gold typically outperforms during the second half of the inflation regime as investors seek protection from social, geopolitical, and financial instability.
• Bitcoin has been the best performing asset class in 8 out of the past 11 years and we strongly believe it deserves a place in investors’ strategic asset allocation.
• Semiconductor valuations have reset: It may be time to reengage after a major repricing since last summer.
• India is one of the most compelling structural growth stories in the market, and the recent India correction is a buying opportunity.
Gold is the Second Half Team (9:33)
Government spending accounts for a whopping one-third of U.S. GDP. Deep spending cuts will likely trigger a recession – which would increase U.S. deficits and cause more inflation. And the risk isn’t just inflation—it’s fragmentation. These cuts are happening amid a trade war, which makes everything more expensive, more uncertain, and more fragile.
This market backdrop, characterized by inflation, war, uncertainty and growing financial instability, is built for gold. Historical data shows that commodities outperform during the first half of the inflation regime, while gold typically outperforms during the second half of the inflation regime as investors seek protection from social, geopolitical and financial instability.
Dividing the Bull Market into Two Halves

Source: Bloomberg, VanEck. “Commodities” represented by the Bloomberg Commodity Index. Past performance is no guarantee of future results. Any projections, forecasts and other forward-looking statements are not indicative of actual results, are for illustrative purposes only, are valid as of the date of this communication, and are subject to change without notice.
Bitcoin Deserves to be Owned (12:47)
Unlike traditional assets, Bitcoin is decentralized—not controlled by any single government or central bank. It is much more volatile than gold and should not be confused as a risk-off asset. Expect prices to remain under pressure in the near term. However, Bitcoin is well-positioned to rally in the future and continue its strong run of performance.
Bitcoin Has Been the Best Performing Asset Class in 8 Out of the Past 11 Years
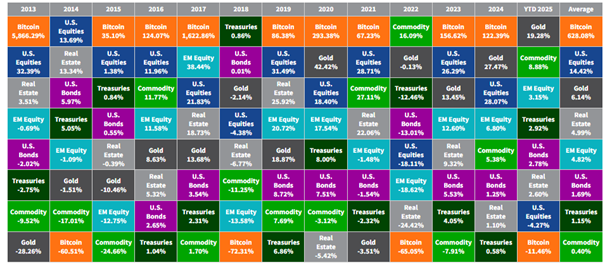
Source: Morningstar. As of March 2025. “Bitcoin” represented by MVIS CryptoCompare Bitcoin Index; “US Equities” represented by S&P 500 Index; “Gold” represented by S&P GSCI Gold Spot; “EM Equity” represented by Fidelity Emerging Markets Index; “Real Estate” represented by the NASDAQ Global Real Estate Index; “US Bonds” represented by Bloomberg US Aggregate Bond USD; “Treasuries” represented by Bloomberg Aggregate Bond Treasury Index; “Commodities” represented by Bloomberg Commodity Index. Index definitions included at the end of this presentation. Digital assets are subject to significant risk and are not suitable for all investors. Not intended as an offer or recommendation to buy or sell any assets referenced herein. Past performance is not indicative of future results.
Finding Opportunity in the Chaos: Semiconductors and India (13:34)
Market volatility often triggers a flight to safety, but for astute investors, it can also open the door to compelling opportunities. When asset prices move sharply in response to fear, uncertainty, or liquidity pressures, dislocations can emerge—creating mispricings that don’t reflect underlying fundamentals. Two of our favorite areas are in semiconductors related to AI and India—as the U.S. economy slows, global stimulus efforts are accelerating elsewhere, and India remains a top conviction idea.
Comprehensive Model Portfolio Solutions: From Core to Thematic (17:32)
VanEck’s model portfolio solutions span from comprehensive asset allocation to thematic offerings. Our Wealth Builder Plus Portfolios provide core exposure to equities and fixed income with a strategic allocation to real and digital assets. Security selection, which marries the elements of both active and passive strategies, allows the portfolio to adapt to changing markets. Its systematic investment approach focuses on maximizing diversification and monitoring risk to optimize performance over the long term.
To learn more about market trends and portfolio positioning, listen to the full discussion here.
To receive more Model Portfolio insights, sign up in our subscription center.
Article authored by David Schassler
IMPORTANT DISCLOSURES
This is not an offer to buy or sell, or a recommendation to buy or sell any of the securities, financial instruments or digital assets mentioned herein. The information presented does not involve the rendering of personalized investment, financial, legal, tax advice, or any call to action. Certain statements contained herein may constitute projections, forecasts and other forward-looking statements, which do not reflect actual results, are for illustrative purposes only, are valid as of the date of this communication, and are subject to change without notice. Actual future performance of any assets or industries mentioned are unknown. Information provided by third party sources are believed to be reliable and have not been independently verified for accuracy or completeness and cannot be guaranteed. VanEck does not guarantee the accuracy of third party data. The information herein represents the opinion of the speaker(s), but not necessarily those of VanEck or its other employees.
The models are not mutual funds or other types of securities and will not be registered with the Securities and Exchange Commission as investment companies under the Investment Company Act of 1940, as amended, and no units or shares of the models will be registered under the Securities Act of 1933, as amended, nor will they be registered with any state securities regulator. Accordingly, the models are not subject to compliance with the requirements of such acts.
Investments in bitcoin and other digital assets are subject to significant risk and are not suitable for all investors. It is possible to lose your entire principal investment.
An investment in the Strategy may be subject to risks which include, but are not limited to, risks related to small- and medium-capitalization companies, emerging market issuers, foreign securities, foreign currency, equity securities, credit, interest rate, floating rate, commodities, underlying funds, derivatives, non-diversification, sector, market, economic, political, regulatory, world event, index tracking, cash transactions, operational, authorized participant concentration, no guarantee of active trading market, trading issues, passive management, fund shares trading, premium/discount risk and liquidity of fund shares, issuer-specific changes, and index-related concentration risks, all of which may adversely affect the Strategy. Emerging market issuers and foreign securities may be subject to securities markets, political and economic, investment and repatriation restrictions, different rules and regulations, less publicly available financial information, foreign currency and exchange rates, operational and settlement, and corporate and securities laws risks. Small- and medium-capitalization companies may be subject to elevated risks. Derivatives may involve certain costs and risks such as liquidity, interest rate, and the risk that a position could not be closed when most advantageous.
Please note that any content generated by an Artificial Intelligence (AI) system has not been subject to a human review, and thus no assurance can be made as to its accuracy. Please exercise caution when using AI systems and verify the content produced through such systems wherever possible.
No part of this material may be reproduced in any form, or referred to in any other publication, without express written permission of VanEck.
All investing is subject to risk, including the possible loss of the money you invest. As with any investment strategy, there is no guarantee that investment objectives will be met and investors may lose money. Diversification does not ensure a profit or protect against a loss in a declining market. Past performance is no guarantee of future results.
© Van Eck Associates Corporation.

Volatility reared its head across the financial markets in April and crypto assets were not spared. The uncertainties around tariff policy in the aftermath of “Liberation Day” led to a month where bitcoin (BTC) dropped below $76,000 before recovering mid-month and rising nearly 25% off that low through yesterday.
Equities and other risk assets were also exposed to this volatility, but what was notable to see is that, once again, crypto assets recovered faster than other risk assets. Using the Nasdaq Crypto IndexTM (NCITM) as the proxy for the digital asset market, we can see that crypto outperformed both the S&P 500 and gold in the weeks following the US regional banking crisis in early 2023, the yen carry trade unwinding in August of 2024, and the implementation of Trump’s tariffs this month.

Source: Hashdex Research with data from CF Benchmarks and Bloomberg (from March 9, 2023 to April 27, 2025). Since 30 full days have not yet passed since “Liberation Day,” we use performance data up through 4/27/25 to illustrate the period.
Why is this? We are seeing a growing convergence of market behavior, regulatory progress, and real-world use cases that are strengthening the investment case for crypto. Two major developments in particular deserve attention. First, bitcoin is maturing as a store-of-value asset, increasingly behaving like “digital gold” in institutional portfolios. Second, the rapid global adoption of stablecoins and the emerging tokenization trend are reinforcing the value proposition of smart contract platforms like Ethereum and Solana, underscoring their role as the infrastructure layer of a new financial system. Together, these trends are accelerating crypto’s integration into the global economy and creating compelling long-term investment opportunities.
Bitcoin’s growing role as a store of value
Bitcoin’s core investment thesis has long centered around its scarcity, decentralization, and resistance to censorship. But for much of its history, it was seen more as a speculative asset than a reliable store of value. We are seeing increasing evidence that this perception is now shifting, notably last week when BTC rose alongside gold as stock indices fell and the US dollar hit a three-year low.
Three developments have been key to bitcoin’s evolution as a store-of-value asset:
- Macro environment alignment: Bitcoin is increasingly viewed as a hedge against currency debasement and long-term monetary instability. With developed economies still grappling with inflationary pressures and debt sustainability, investors are reassessing the role of hard assets in portfolios. Gold has historically served this role—but bitcoin, with its verifiable scarcity (a fixed 21 million supply), global liquidity, and portability, is increasingly seen as a digital alternative. Recent correlations during macro events further reinforce this view. In 2023 and early 2024, bitcoin often moved in tandem with gold during geopolitical tensions and inflationary scares, signaling that markets are beginning to treat it as a safe-haven asset rather than a purely risk-on trade.
- Institutional infrastructure and spot ETFs: The launch of US-listed spot bitcoin ETFs in early 2024 marked a watershed moment. This development provided investors with a simple, regulated, and cost-efficient way to gain exposure to bitcoin through traditional financial channels. As more institutional-grade custody, execution, and compliance infrastructure goes live, we expect bitcoin’s correlation with traditional safe-haven assets to strengthen further, reinforcing its store-of-value narrative.
- On-chain metrics and long-term holders: Perhaps most telling is the behavior of bitcoin holders. On-chain data shows that a significant percentage of bitcoin is now held by long-term investors—wallets that have not moved funds for over a year. These holders typically exhibit low sensitivity to price volatility and reflect growing confidence in bitcoin as a long-term asset. This behavior supports price stability and reduces sell pressure during market downturns. It also aligns with the characteristics we expect from a mature store-of-value asset.
Stablecoins, tokenization, and the smart contract opportunity
While bitcoin is moving toward a role as digital gold, the demand for stablecoins—digital assets pegged to fiat currencies, most commonly the US dollar—is rising. In addition, tokenized money-market funds are on the rise since the beginning of 2023, with traditional institutions, such as BlackRock and UBS, already tapping into this market and gathering billions of dollars under management in their own version of yield-bearing dollar tokens. Ethereum, its suite of Layer-2 solutions, and other smart contract platforms like Solana and Avalanche are the very networks used to tokenize real-world assets, facilitating transactions and adding programmability and new utility made possible due to the speed, security and composability of public blockchains. Dollar stablecoins, particularly USDC and USDT, now facilitate nearly $3 trillion in annual transaction volume, surpassing the combined volumes of PayPal, Venmo, and Western Union. Their utility spans remittances, on-chain trading, and merchant payments.
The growth of stablecoins and tokenization is clearly not merely a crypto-native phenomenon. Financial institutions and fintech companies are integrating stablecoins into their products, and multiple jurisdictions—from Singapore to Brazil to the US—are exploring regulatory frameworks to support their use.
So, why does this matter for Ethereum and other smart contract platforms?
- Stablecoins and tokenization drive blockchain activity: Stablecoins are the most widely used applications on programmable public blockchains. Ethereum remains the dominant platform for stablecoin issuance and transaction settlement, and its competitors are also experiencing continued growth in the past several years. This trend generates fees on these networks, securing demand for their native tokens, and incentivizing ongoing infrastructure development. This economic activity supports the investment case for assets like ETH and SOL as “yield-generating” assets (through staking) and as the fuel required to power network computation.
- Network effects and platform stickiness: Smart contract platforms benefit from strong developer mindshare, extensive tooling, and a deep ecosystem of wallets, DeFi protocols, and onramps. Stablecoins and tokenization amplify this ecosystem by making blockchains more usable and more financially relevant to everyday users. As these become embedded into mainstream financial products—like savings accounts, neobanks, and cross-border commerce—they create persistent demand for the networks that support them.
- Smart contract monetization models: The success of stablecoins and the emerging trend of tokenization also hint at the business models of tomorrow. Blockchains that can efficiently process high volumes of transactions—while maintaining low fees and regulatory compliance—will capture significant value.
Implications for investors
These dual narratives—bitcoin as digital gold and smart contract platforms as financial infrastructure—are not mutually exclusive. They complement one another and represent two pillars of the evolving digital asset thesis. For long-term investors, this presents a clearer framework for portfolio construction:
• Bitcoin: A macro hedge and store of value, increasingly playing a role similar to gold in diversified portfolios. Best positioned to benefit from macro uncertainty and institutional adoption.
• Smart contract platforms: Growth assets tied to the expansion of on-chain economic activity, especially in stablecoin usage, tokenization, and DeFi. These platforms will benefit from network usage, staking yields, and infrastructure adoption.
As always, risks remain—from regulatory fragmentation to network competition. But unlike previous cycles, we are now seeing real-world adoption driving demand and investor interest. Bitcoin and smart contract platforms are no longer just ideas. They are working systems with proven use cases and growing economic gravity.
At Hashdex, we believe digital assets are entering a new phase—one characterized less by speculative mania and more by measurable integration into the global economy. Bitcoin’s maturing role as a store of value, alongside smart contracts’ central position in powering stablecoin and tokenization infrastructure, underscores this shift.
Our index-based investment strategies are built to capture this evolution: favoring assets with enduring network effects, regulatory momentum, and demonstrated economic utility. As the market continues to evolve, we remain committed to helping investors navigate this journey with clarity, conviction, and a long-term mindset.


Gold, Bitcoin, and Emerging Markets: Our Market Playbook

C051 ETF spårar de 30 företagen med högst direktavkastning i euroområdet

Crypto’s current one-two punch: Bitcoin and stablecoins

AGYE ETF för möjligheter med högavkastande obligationer
Virtune meddelar byte av Indexleverantör

Bitcoin var den bäst presterande tillgången men…

Sju börshandlade fonder som investerar i försvarssektorn

Världens första europeiska försvars-ETF från ett europeiskt ETF-företag lanseras på Xetra och Euronext Paris

21Shares bildar exklusivt partnerskap med House of Doge för att lansera Dogecoin ETP i Europa

HANetfs Tom Bailey om framtiden för europeiska försvarsfonder
-
 Nyheter2 dagar sedan
Bitcoin var den bäst presterande tillgången men…
-
 Nyheter4 veckor sedan
Sju börshandlade fonder som investerar i försvarssektorn
-
 Nyheter4 veckor sedan
Världens första europeiska försvars-ETF från ett europeiskt ETF-företag lanseras på Xetra och Euronext Paris
-
 Nyheter4 veckor sedan
21Shares bildar exklusivt partnerskap med House of Doge för att lansera Dogecoin ETP i Europa
-
 Nyheter3 veckor sedan
HANetfs Tom Bailey om framtiden för europeiska försvarsfonder
-

 Nyheter2 veckor sedan
Fastställd utdelning i MONTDIV april 2025
-

 Nyheter4 veckor sedan
Investera i Polen med börshandlade fonder
-

 Nyheter5 dagar sedan
Investerarna söker fonder som ger exponering mot försvarsindustrin