Bitcoin lade till 40 miljarder dollar till sitt börsvärde över natten den 16 februari när det positiva sentimentet började vinna mark och en så kallas short squeeze sköt värdet på kryptotillgången till sitt högsta pris på sex månader. I denna artikel tittar ETC Group på varför priset på Bitcoin rusat till sin högsta nivå på sex månader
Bitcoin har nu stigit med 11,19 procent under de senaste 24 timmarna för att nå 24 500 USD och Ethereum har hoppat till 1 680 USD.
Det började med en short squeeze, men en rad spännande mindre händelser påverkar också samtidigt Bitcoin närmar sig en nyckelprisnivå. Utbudet av Bitcoins där innehavarna har vinst är nu den högsta nivån sedan i april 2022.
Short squeeze flyttar marknader: nyckelpriser strategi
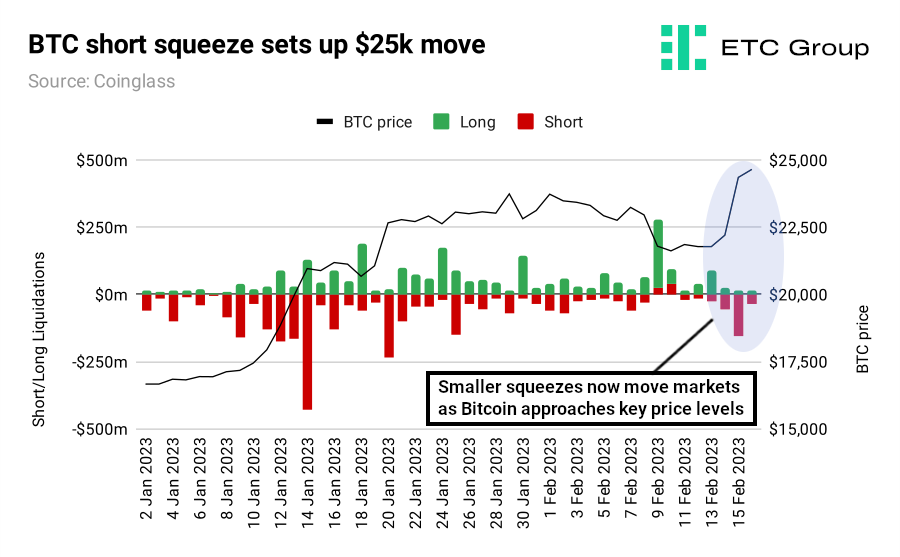
Data från derivatsajten Coinglass visar att blankare– de som satsar på att priset på Bitcoin kommer att falla – slogs ut från sina positioner mellan 13 och 16 februari. Siffrorna visar att cirka 190 miljoner USD av korta Bitcoin-positioner likviderades under dessa 48 timmarna.
När blankningssäljare ser att deras stop loss överskrids, tvingas de köpa tillbaka Bitcoin till de nya, högre marknadspriserna, vilket i sin tur ser att det tillgängliga utbudet av Bitcoin på börser minskar, och det finns en allmän brådska från blankarna att köpa tillbaka till lägsta tillgängliga pris och därmed undvika stora potentiella förluster.
Med denna senaste prishöjning har Bitcoin sprungit ända upp till 24,5 000 dollar, det högsta priset kryptovalutan har handlats till på sex månader. Det som är mest spännande med vad som händer den här gången är att det krävs relativt små mängder positionering på handelsmarknaden för att få dessa rörelser att hända. För oss drar det slutsatsen att det råder en allmän säljarutmattning vid dessa prisnivåer.
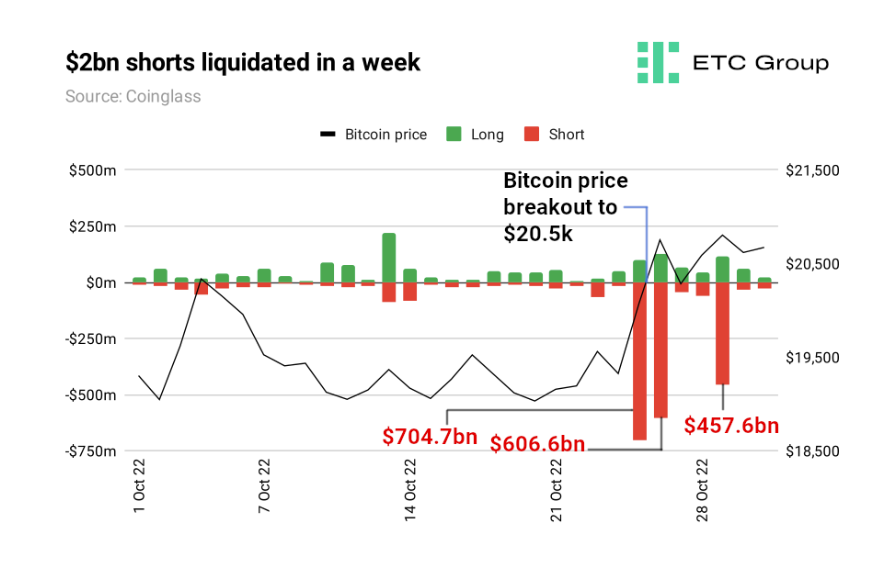
Blankade positioner om 190 miljoner korta positioner kan tyckas vara mycket, men det är en bråkdel av de nivåer vi såg i slutet av förra året. För jämförelse, titta på de sista dagarna av oktober 2022, när blankarnas återköp skickade Bitcoin till kanten av närmare 21 000 USD och Ethereum steg med 25 procent.
Mellan 26 oktober och 31 oktober likviderades två miljarder dollar i handlarpositioner som satsade på att priset på krypto skulle falla. De inträffade i tre stora korta likvidationshändelser med belåning på mer än 450 miljoner dollar på en dag.
Så nu flyttar mindre blankarnas återköp marknader när Bitcoin närmar sig nyckelnivån för realiserat pris som skulle markera en indikation på närmar sig slutet av Crypto Winter.
Tidigare kryptovintrar – så kallade för att de inte nödvändigtvis sammanfaller med nedgångar på aktiemarknaden – har kännetecknats av långa perioder med låg prisvolatilitet, oförändrade eller begränsade handelsvolymer, baisseartade prisåtgärder och stora nedgångar från rekordpriser.
Uppbackad av makro
Den amerikanska inflationen svalnade något i januari, vilket markerade den sjunde fallande månaden i rad, enligt data som träffade marknaderna onsdagen den 15 februari.
Precis som kryptomarknaderna såg ut som om de skulle falla under det psykologiskt viktiga marknadsvärdet på 1 biljon dollar, satte detta till bränsle till elden från investerare vars oro över inflationen minskar.
Det har också stötts av färska IMF-data som visar ”förvånansvärt stark” efterfrågan, BNP och tillväxt i Nordamerika och Europa, och prognoser som höjer globala tillväxtprognoser, detta innebär bättre utsikter för fallande räntor under hela året, och en bättre miljö för risker tillgångar som krypto och aktier.
IMFs ekonomer har höjt sin prognos för global tillväxt i år med 0,2 procentenheter, och förväntar sig att den globala ekonomin kommer att växa med 2,9 procent 2023 och sedan med 3,1 procent 2024.
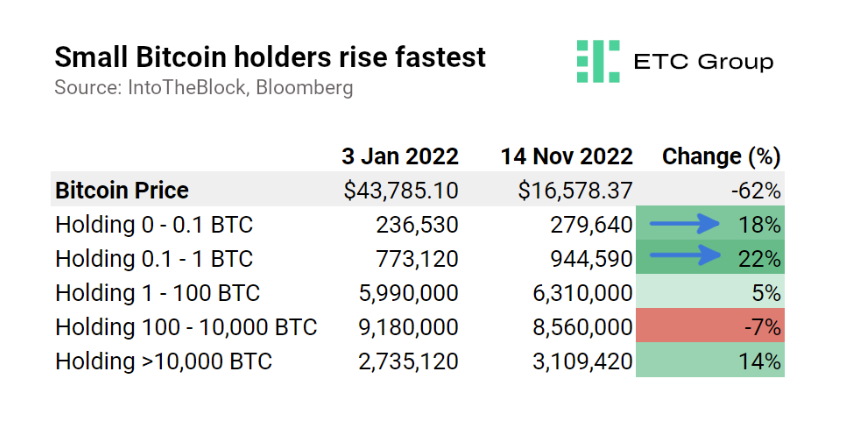
2022 var en hotfull innehavsperiod för Bitcoin-investerare. Nätverksdata visar ändå att antalet småinnehavare exploderade snabbast till alla tiders högsta nivåer under den FTX-inducerade nedgången i november 2022 till ett Bitcoin-pris på 16 578,37 USD.
Antalet mindre investerare, de som har plånböcker som rymmer upp till 0,1 BTC, klättrade rejält mellan januari 2022 och slutet av förra året, trots att priset på Bitcoin föll med 70 procent.
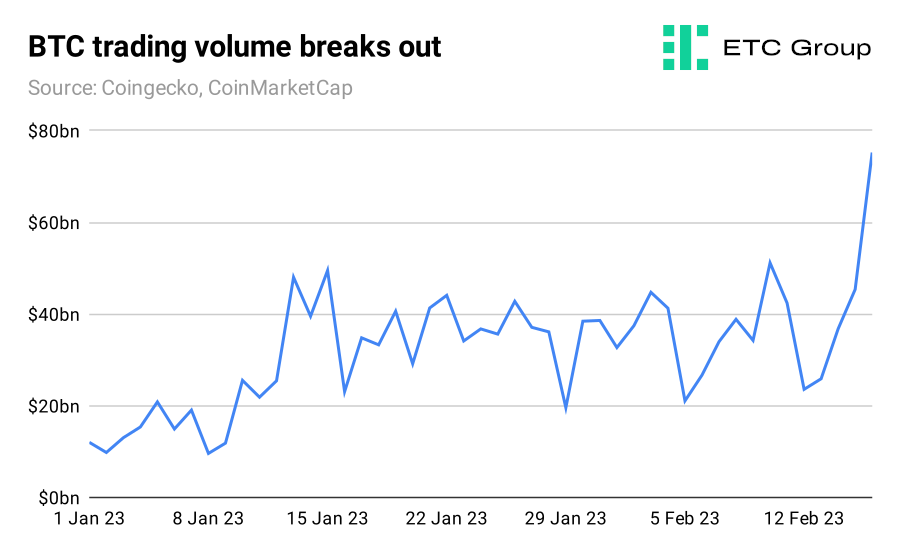
Innehavare – eller HODLers, om du föredrar det – har aldrig hållit så hårt fast vid sin föredragna tillgång. Ett av de andra sätten det går att kategorisera marknadssentiment är att följa hur många affärer (mätt under en 24-timmarsperiod, ofta kallad ”volym”) användare gör med Bitcoin.
I djupet av kryptos marknadskrasch rasade den dagliga handelsvolymen. Även mitt i årsskiftets optimism sjönk 24-timmarshandelsvolymen den 8 januari under 10 miljarder dollar för första gången på över två år.
Ett annat nyckelmått att titta på för att se det övergripande tillståndet på marknaden är att titta på antalet Bitcoin-innehavare som säljer mynt med vinst, jämfört med de som säljer med förlust. Den första positionen är positiv, eftersom handlare tjänar pengar och är mer benägna att återvända till marknaden. Det motsatta är också sant.
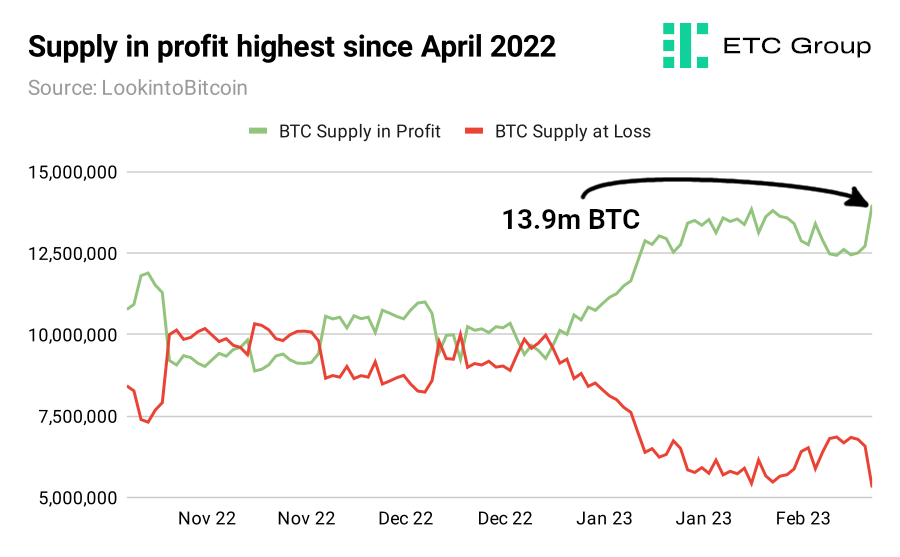
Med 13,9 miljoner BTC nu i vinst, jämfört med 5,8 miljoner BTC med förlust, är detta ett högvattenmärke som inte setts sedan april 2022.
Kryptomarknadsanalysanalytiker som de på ETC Group tittar på data i kedjan för att hitta mönster. ETC Group gör det genom att titta på hela historien för de öppet tillgängliga datapunkter som blockkedjor producerar, och sedan utföra beräkningar för att hitta medelvärden och trender.
As April winds down, markets remain on edge, with escalating tariffs and renewed trade tensions keeping volatility in focus. In this summary of our full-length newsletter, we spotlight gold and gold equities, both of which have surged to record levels. We also take a step back from the day-to-day noise in crypto to explore the broader shifts in the regulatory landscape in our latest Whitepaper and present Celestia in detail. Finally, we assess how Moat indexes have held up and evolved amid the turbulence.
Gold & Gold mining equities tend to shine during stress periods
Source: VanEck, World Gold Council.
Gold has attracted renewed interest from investors amid concerns about inflation, currency volatility, and overall market uncertainty. Gold mining companies have recently reported improved profit margins and cash generation, with some initiating share buybacks and maintaining relatively strong balance sheets. Despite these developments, many continue to trade below their historical valuation averages.
While historical trends indicate that gold and gold mining equities have outperformed during certain periods of market stress, these patterns may not repeat under different economic conditions. Performance can be influenced by a range of factors including interest rates, central bank policy, geopolitical developments, and investor sentiment.
⚖️ Whitepaper Highlights: How New Crypto Regulations May Shape the Future
Cryptocurrencies are entering a new era. With the re-election of Donald Trump and the implementation of the European Union’s Markets in Crypto-Assets (MiCA) regulation, digital assets are moving into a landscape defined not just by innovation, but also by regulatory clarity.
MiCA’s structured and transparent approach aims to promote legitimacy, safeguard investors, and enhance trust in digital asset markets across Europe. It could also serve as a blueprint for other jurisdictions looking to regulate crypto effectively.
Most blockchains, like Ethereum or Bitcoin, are monolithic which means they perform all major functions (consensus, data availability, and execution) on a single layer. This design ensures security but according to new modular networks, limits scalability and flexibility.
The modular blockchain thesis, which Celestia is leading, proposes separation of layers and respective responsibilities in the network.
Note: This article in not accessible to our UK readers.
🌊 Riding the Gold Wave
Chasing the Vein: Fund Flows into Gold Miners
Source: Mining.com. Data as of 21 March 2025. Note: Data covers 493 funds with combined assets under management of $62 billion.
U.S. equity markets experienced significant declines during the month of March. Meanwhile, spot gold price recorded new all-time highs, surpassing the $3,000 per ounce mark on 14 March and closing at a record price of $3123.57 on March 31, a 9.30% ($265.73) monthly gain. As of 31 March, gold prices have risen by 93.61% over the past five years (1). Investors should keep in mind that past performance is not representative of future results.
The gold miners, as represented by the NYSE Arca Gold Miners Index (GDMNTR), outperformed significantly, up 15.51% during March (2). This gain reflects both their operational leverage to rising gold prices and market perceptions of relative value. However, gold miners can also be subject to heightened volatility, operational risks, and sensitivity to commodity price swings.
While gold and gold equities may serve as diversifiers in a portfolio due to their historically low correlations with many asset classes, investors should remain mindful of the inherent risks, including price volatility, currency movements, and shifts in investor sentiment that can lead to rapid reversals in performance.
Market turbulence in March weighed on stocks. The Moat Index was not immune to the market turmoil, as it declined along with the broad U.S. equity market ending the month lower. However, the Moat Index showed resilience relative to the S&P 500—thanks in part to defensive sector resilience and underweight exposure to mega-caps.
At the same time, the SMID Moat Index lagged small and mid-caps in March. Smaller U.S. stocks were also impacted by global trade tensions and economic growth concerns with the broad small- and mid-cap benchmarks falling during the month. However, year-to-date, the SMID Moat Index remains ahead of the broader small- and mid-cap markets.
(1) Source: World Gold Council, ICE Data Services, FactSet Research Systems Inc.
(2) Source: Financial Times.
IMPORTANT INFORMATION
This is marketing communication. Please refer to the prospectus of the UCITS and to the KID/KIID before making any final investment decisions. These documents are available in English and the KIDs/KIIDs in local languages and can be obtained free of charge at www.vaneck.com, from VanEck Asset Management B.V. (the “Management Company”) or, where applicable, from the relevant appointed facility agent for your country.
For investors in Switzerland: VanEck Switzerland AG, with registered office in Genferstrasse 21, 8002 Zurich, Switzerland, has been appointed as distributor of VanEck´s products in Switzerland by the Management Company. A copy of the latest prospectus, the Articles, the Key Information Document, the annual report and semi-annual report can be found on our website www.vaneck.com or can be obtained free of charge from the representative in Switzerland: Zeidler Regulatory Services (Switzerland) AG, Neudtadtgasse 1a, 8400 Winterthur, Switzerland. Swiss paying agent: Helvetische Bank AG, Seefeldstrasse 215, CH-8008 Zürich.
For investors in the UK: This is a marketing communication targeted to FCA regulated financial intermediaries. Retail clients should not rely on any of the information provided and should seek assistance from a financial intermediary for all investment guidance and advice. VanEck Securities UK Limited (FRN: 1002854) is an Appointed Representative of Sturgeon Ventures LLP (FRN: 452811), which is authorised and regulated by the Financial Conduct Authority (FCA) in the UK, to distribute VanEck´s products to FCA regulated firms such as financial intermediaries and Wealth Managers.
This information originates from VanEck (Europe) GmbH, which is authorized as an EEA investment firm under MiFID under the Markets in Financial Instruments Directive (“MiFiD). VanEck (Europe) GmbH has its registered address at Kreuznacher Str. 30, 60486 Frankfurt, Germany, and has been appointed as distributor of VanEck products in Europe by the Management Company. The Management Company is incorporated under Dutch law and registered with the Dutch Authority for the Financial Markets (AFM).
This material is only intended for general and preliminary information and shall not be construed as investment, legal or tax advice. VanEck (Europe) GmbH and its associated and affiliated companies (together “VanEck”) assume no liability with regards to any investment, divestment or retention decision on the basis of this information. The views and opinions expressed are those of the author(s) but not necessarily those of VanEck. Opinions are current as of the publication date and are subject to change with market conditions. Information provided by third party sources is believed to be reliable and have not been independently verified for accuracy or completeness and cannot be guaranteed.
Morningstar® Wide Moat Focus IndexSM, Morningstar® US Sustainability Moat Focus Index, Morningstar® US Small-Mid Cap Moat Focus IndexSM, and Morningstar® Global Wide Moat Focus IndexSM are trademarks or service marks of Morningstar, Inc. and have been licensed for use for certain purposes by VanEck. VanEck’s ETFs are not sponsored, endorsed, sold or promoted by Morningstar, and Morningstar makes no representation regarding the advisability of investing in the ETFs. Morningstar bears no liability with respect to the ETFs or any securities.
Effective December 15, 2023, the carbon risk rating screen was removed from the Morningstar® US Sustainability Moat Focus Index. Effective December 17, 2021, the Morningstar® Wide Moat Focus IndexTM was replaced with the Morningstar® US Sustainability Moat Focus Index. Effective June 20, 2016, Morningstar implemented several changes to the Morningstar® Wide Moat Focus Index construction rules. Among other changes, the index increased its constituent count from 20 stocks to at least 40 stocks and modified its rebalance and reconstitution methodology. These changes may result in more diversified exposure, lower turnover, and longer holding periods for index constituents than under the rules in effect prior to that date.
NYSE Arca Gold Miners Index is a service mark of ICE Data Indices, LLC or its affiliates (“ICE Data”) and has been licensed for use by VanEck UCITSETF plc (the “Fund”) in connection with the ETF. Neither the Fund nor the ETF is sponsored, endorsed, sold or promoted by ICE Data. ICE Data makes no representations or warranties regarding the Fund or the ETF or the ability of the NYSE Arca Gold Miners Index to track general stock market performance. ICE DATA MAKES NO EXPRESS OR IMPLIED WARRANTIES, AND HEREBY EXPRESSLY DISCLAIMS ALL WARRANTIES OF MERCHANTABILITY OR FITNESS FOR A PARTICULAR PURPOSE WITH RESPECT TO THE NYSE ARCA GOLD MINERS INDEX OR ANY DATA INCLUDED THEREIN. IN NO EVENT SHALL ICE DATA HAVE ANY LIABILITY FOR ANY SPECIAL, PUNITIVE, INDIRECT, OR CONSEQUENTIAL DAMAGES (INCLUDING LOST PROFITS), EVEN IF NOTIFIED OF THE POSSIBILITY OF SUCH DAMAGES. ICE Data Indices, LLC and its affiliates (“ICE Data”) indices and related information, the name “ICE Data”, and related trademarks, are intellectual property licensed from ICE Data, and may not be copied, used, or distributed without ICE Data’s prior written approval. The Fund has not been passed on as to its legality or suitability, and is not regulated, issued, endorsed’ sold, guaranteed, or promoted by ICE Data.
It is not possible to invest directly in an index.
Investing is subject to risk, including the possible loss of principal. Investors must buy and sell units of the UCITS on the secondary market via an intermediary (e.g. a broker) and cannot usually be sold directly back to the UCITS. Brokerage fees may incur. The buying price may exceed, or the selling price may be lower than the current net asset value. The indicative net asset value (iNAV) of the UCITS is available on Bloomberg. The Management Company may terminate the marketing of the UCITS in one or more jurisdictions. The summary of the investor rights is available in English at: complaints-procedure.pdf (vaneck.com). For any unfamiliar technical terms, please refer to ETF Glossary | VanEck.
No part of this material may be reproduced in any form, or referred to in any other publication, without express written permission of VanEck.
BBVA Acción Eurostoxx 50 ETF FI Cotizado Armonizado (BBVAE ETF) med ISIN ES0105321030, strävar efter att spåra EURO STOXX® 50-index. EURO STOXX® 50-indexet följer de 50 största företagen i euroområdet.
Den börshandlade fondens TER (total cost ratio) uppgår till 0,20 % p.a. ETFen replikerar resultatet av det underliggande indexet genom full replikering (köper alla indexbeståndsdelar). Utdelningarna i ETFen delas ut till investerarna (halvårsvis).
BBVA Acción Eurostoxx 50 ETF FI Cotizado Armonizado har tillgångar på 133 miljoner euro under förvaltning. Denna ETF lanserades den 3 oktober 2006 och har sin hemvist i Spanien.
Beskrivning BBVA Acción Eurostoxx 50 ETF FI Cotizado Armonizado
Med BBVA Acción Eurostoxx 50 ETF FI Cotizado Armonizado deltar investerare i ökningen av värdet på aktierna i de 50 största konglomeraten i euroområdet (euroområdet). Euro Stoxx 50-indexet inkluderar aktier från 8 länder i euroområdet: Belgien, Finland, Frankrike, Tyskland, Irland, Italien, Nederländerna och Spanien.
Explore Dogecoin’s impact on crypto, turning internet memes into cultural and financial assets.
𝕋𝕚𝕞𝕖 ℂ𝕠𝕕𝕖𝕤:
00:00 – Intro
00:27 – Where do Memes come from?
03:13 – What are some of the first Memes you remember?
10:28 – Do these things have value?
14:04 – The different types of cryptocurrencies
17:20 – How did Dogecoin start?
24:26 – What is some of the utility?
28:36 – How does it fit into the portfolio?
30:38 – Final thoughts
Research Newsletter
Each week the 21Shares Research team will publish our data-driven insights into the crypto asset world through this newsletter. Please direct any comments, questions, and words of feedback to research@21shares.com
Disclaimer
The information provided does not constitute a prospectus or other offering material and does not contain or constitute an offer to sell or a solicitation of any offer to buy securities in any jurisdiction. Some of the information published herein may contain forward-looking statements. Readers are cautioned that any such forward-looking statements are not guarantees of future performance and involve risks and uncertainties and that actual results may differ materially from those in the forward-looking statements as a result of various factors. The information contained herein may not be considered as economic, legal, tax or other advice and users are cautioned to base investment decisions or other decisions solely on the content hereof.