
Nyheter
Tokenization Reigns Supreme in Q3 While Ethereum Rivals Pivot into Becoming ETH Scaling Solutions
Macro conditions remained uncertain in Q3 as the Fed raised interest rates 25 bps in July but skipped a rate hike in September, leaving the door open for future rate hikes. As a result, the 10-Year Treasury Bond Yield hit 4.79%, a figure not seen since 2007. The move up in bond yields suggest that investors are anticipating higher interest rates for longer. On the EU front, stagnation worries have climbed – that is, disappointing growth and persistently high inflation. However, there were some positive signs for the EU economy in September, particularly in the UK, where inflation unexpectedly hit the lowest level in a year. With uncertain macroeconomic conditions, investors avoid riskier ventures and look for “safe” assets, causing a repricing to the downside of risk assets including crypto assets. For instance, the S&P 500 earning yield forward estimate is 5.23%, while the 3-Month Treasury rate is higher at 5.62% with not nearly the same level of risk.
The DXY, which measures the strength of the U.S. dollar against a basket of other currencies, has increased in Q3 to levels not seen since November 2022. Crypto has been historically negatively correlated with this index, signaling that investors view it as a risky asset class. However, as crypto expands on use cases, we are seeing increasing decorrelation within the asset class itself, reflected in the fact that some cryptoassets have outperformed even during this market downturn.
Figure 1: Price and TVL Development of Major Crypto Sectors in Q3 2023
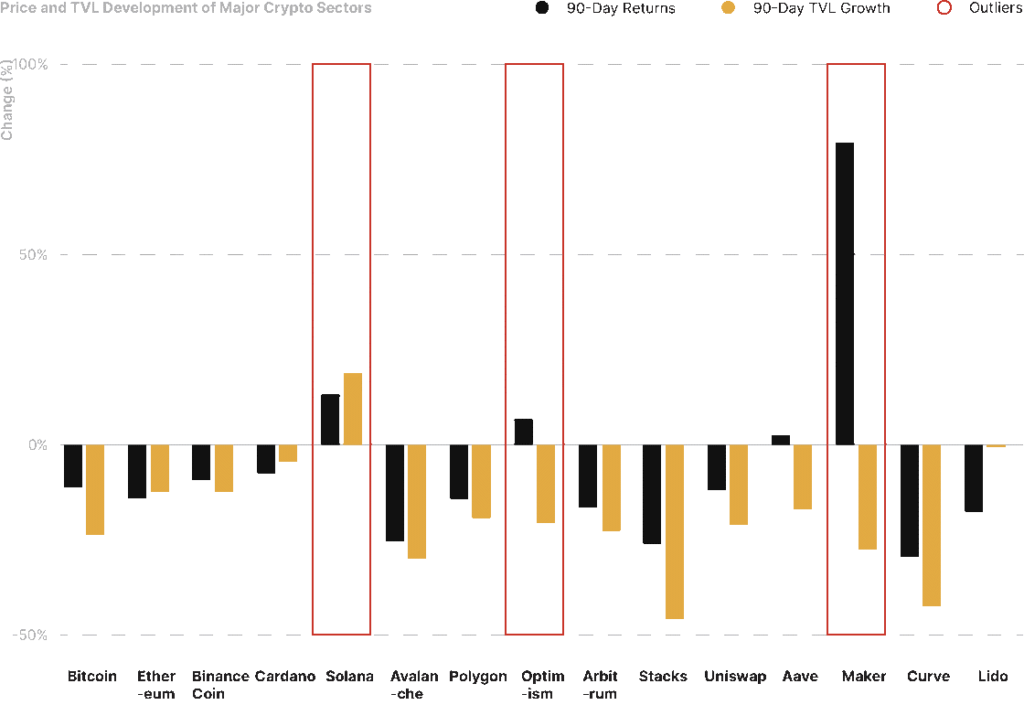
Source: 21shares, CoinGecko, DeFi Llama. Data as of Sep 30, 2023.
Regarding the crypto market, Bitcoin and Ethereum decreased by 11.52% and 13.60% quarter-over-quarter, respectively, while Solana outperformed with a 13.00% return amidst exciting ecosystem developments. Solana Pay integrated its plug-in with e-commerce company Shopify, allowing millions of businesses to use Solana-based stablecoins for payment at checkout, and Visa expanded its USDC cross-border settlement pilot to include the Solana network. On the scaling front, Optimism traded up 6.02% as Coinbase launched its L2 network Base using the OP Stack. Finally, Maker stood out in the DeFi sector with a 79.36% price increase as its fundamentals continue to improve. Maker’s annualized revenue has grown more than tenfold in the past year, from ~$13.75 million to ~$159.19 million, with interest income from real-world assets (RWAs) now comprising more than 60% of the protocol’s total revenue.
Figure 2: Breakdown of important Quarterly Metrics
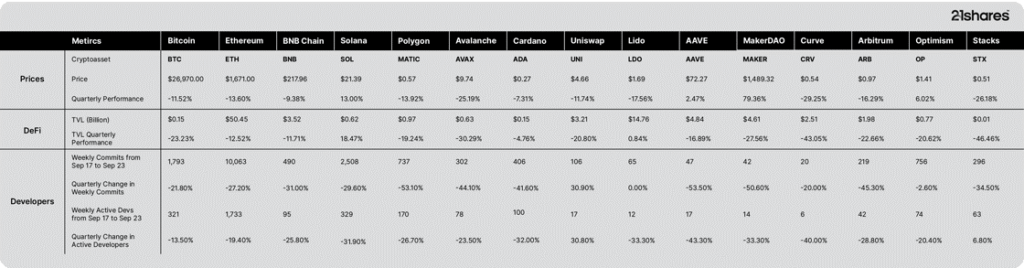
Source: 21shares, Artemis, DeFi Llama, CoinGecko. Data as of Sep 30, 2023.
5 Trends to Remember from Q3
Scaling Solutions is The New Narrative and Epicenter of Innovation, Replacing the “Ethereum Killer” Narrative from The Last Bull Market
Q3 reinforced Ethereum’s modular scaling roadmap as multiple Layer 2 networks continue to gain adoption and converge upon similar architectures. Polygon joined a broad range of L2s launching their custom development kit to enable teams to deploy their own chains easily with the release of Polygon CDK – Arbitrum has ”Orbit,” zkSync released the ”ZK Stack,” and Optimism has the ”OP Stack,” upon which Coinbase launched its L2 network Base in August. Astar Network, a Polkadot parachain and one of Japan’s leading smart contract platforms, already announced “Astar zkEVM,” an upcoming Ethereum L2 built using the latest Polygon toolkit. While it’s still unclear which standard will accumulate the most network effects, the fierce competition between L2s is unequivocally positive for Ethereum, which may see an influx of new developers, applications, and users. To illustrate this point, weekly active users on the leading Ethereum scaling platforms have more than tripled in the past year, from ~320k in September 2022 to more than 1 million as of September 2023.
Figure 3 – Weekly Active Users on Ethereum L2s
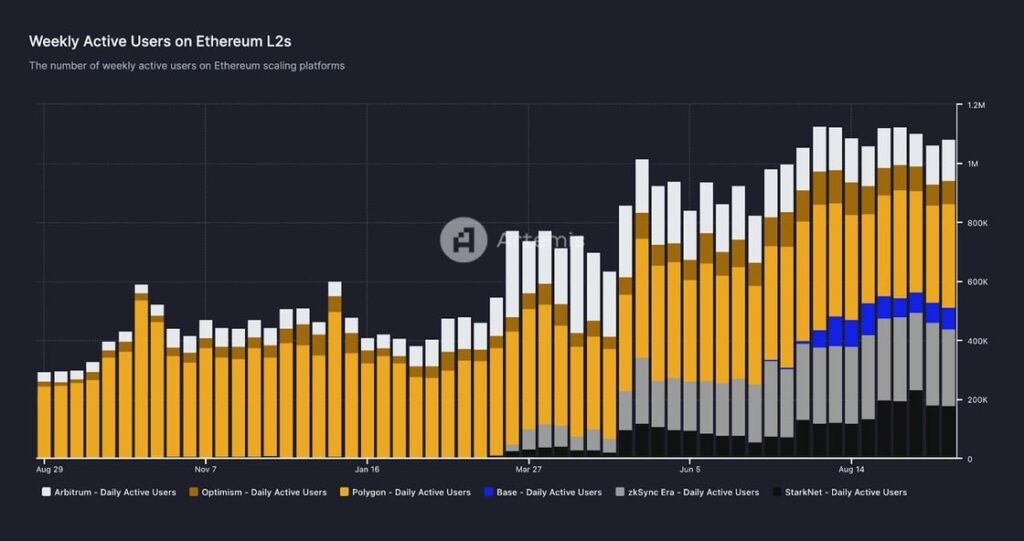
Data Source: Artemis
New Protocols Emerge to Unlock Tokenization’s Full Potential And Mitigate Cybersecurity Risks
In September, Chainlink released a case study showcasing how ANZ Bank, one of Australia’s leading financial institutions, enabled a customer to purchase tokenized Australian carbon credit units issued as NFTs on one blockchain with ANZ-issued New Zealand dollar stablecoins on another blockchain, using CCIP in the backend. Meanwhile, Aave Companies, Coinbase, Circle, and five other leading real-world asset (RWA) players founded the Tokenized Asset Coalition to “accelerate the institutional adoption of tokenizing the world’s assets on the blockchain.”
The initiative is built around three pillars – educational content to facilitate understanding of the ecosystem, development of best practices and industry recommendations to promote a compliant industry, and actively work toward building on-chain infrastructure that scales to the needs of all stakeholders (institutional investors, issuers, platforms, and users). On-chain data points to the continued growth in this vertical, with the estimated value of tokenized U.S. Treasuries increased 31.2% in Q3, from ~$506 million to ~$664 million.
While the excitement is palpable, can DeFi actually help institutions improve profitability? A study by the IMF comparing Aave and Compound to a sample of banks and non-bank financial institutions from more than 20 advanced economies (AE) and 26 emerging markets (EM) had promising results. The IMF found that DeFi offers the lowest marginal costs due to the absence of labor and operational costs. In this regard, it’s not just TradFi that can benefit from DeFi – various protocols like Maker, Frax, and Aave are investing a portion of their assets into RWAs to earn a sustainable yield on their balance sheet. However, a crucial challenge for tokenization’s long-term prospects is overcoming AML/KYC risks, as well as legal and regulatory uncertainties.
Figure 4 – Efficiency of Decentralized vs. Traditional Finance
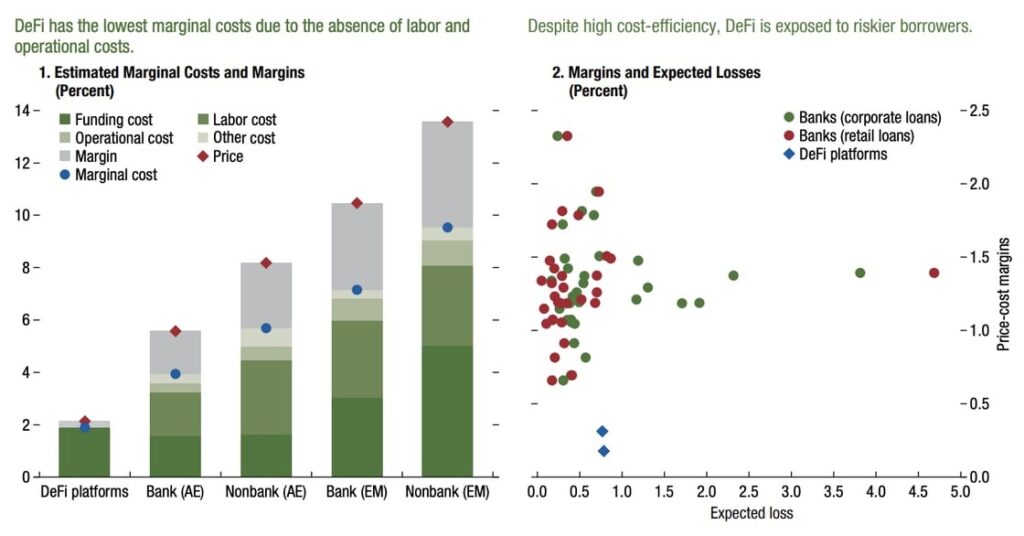
Source: IMF
Decentralization Is A Key Item of Ethereum’s Roadmap, and More Solutions Emerge to Mitigate A Too-Big-To-Fail Scenario
In Q3, notable advancements occurred in the evolution of staking. First, a technology company (SSV) launched a novel software to combat centralization from staking on Ethereum. The protocol leverages Distributed Validator Technology (DVT) to distribute key management and signing duties to multiple parties in an attempt to eliminate a single point of failure, hence enhancing Ethereum’s decentralization. The approach allows multiple node operators to run a single validator, reducing risks of compromise and slashing penalties associated with a single validator, as operators can go offline without affecting the underlying software.
The solution is vital for centralized platforms like exchanges and non-custodial providers like Lido, which could potentially expand its validator set beyond 31. Notwithstanding its promise, caution remains regarding unforeseen risks in this novel implementation. Notwithstanding Ethereum’s positive progress, challenges loom ahead as the Dencun upgrade could likely be delayed until Q1 2024. The decision is contingent on developers deploying a testnet version of the network’s next major upgrade before November’s DevCon, which would give them ample time to validate the new features and enable a robust implementation.
Figure 5: The Concentration of Staking amongst the Different Key Categories on Ethereum
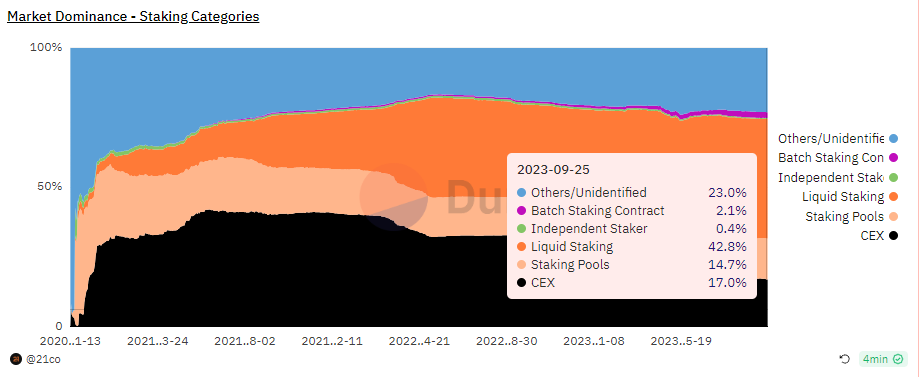
Source: 21co On Dune Analytics
Novel Approaches and Architecture Design To Scale Ethereum to 1,000+ Transactions Per Second With Modularity
Eclipse, the customizable rollup provider, has unveiled its innovative modular scaling solution. Unlike monolithic blockchains, where a single network handles execution, settlement, consensus, and data availability, Eclipse employs a modular approach, separating these functions across different blockchains. In the context of Eclipse, the L2 architecture will use Ethereum for settlement while leveraging Solana for execution on the back of its parallel processing capabilities for high performance.
Further, Eclipse will utilize Celestia to store transaction data on its blockchain and offload Ethereum’s costly storage costs while employing RISC to prove the validity of transactions settled on Ethereum via ZK proofs. This announcement signifies a significant shift in scaling approaches, aligning with our belief in a multi-chain future where diverse smart-contract platforms collaborate for a scalable blockchain landscape, challenging the winner-takes-all scenario.
New Interoperability Features from MetaMask Could Set a Precedent for Cross-Chain Transfers
MetaMask launched its Snaps Open Beta, allowing users to customize their wallet by adding community-built features, similar to how users can customize their smartphone experience by installing various applications from the app store. Built by independent developers, Snaps represents the first step toward MetaMask’s ”permissionless innovation” strategy, enabling anyone to extend the wallet’s functionality. An interesting use case of Snaps is turning MetaMask into a cross-chain wallet by integrating with ShapeShift and THORChain on the backend.
Nevertheless, it’s a pivotal development in the evolution of crypto’s infrastructure, reminiscent of Google’s strategy to harness the power of independent developers to enrich its Chrome Extension ecosystem. Similarly, Metamask is now tapping into the pool of talent and innovative ideas present across external ecosystems. However, users should be wary of what they install on their wallets. Because anyone will be able to contribute, some Snaps may contain bugs or contain malicious software, potentially compromising user funds.
What to Expect
Bitcoin Starts to Become a Software-As-A-Service Blockchain and Not Just a Payment Infrastructure
For instance, Nomic unveiled a non-custodial bridge facilitating BTC transfers into the Cosmos network, expected by the end of October. By utilizing the Cosmos interoperability protocol (IBC), Nomic allows users to natively convert BTC into nBTC, an IBC-compatible token. The innovation circumvents the need for depositing assets into the fragile custodial wallet infrastructure, which saw the exploitation of over $2.2B so far. Further, the product empowers users to engage in established DeFi markets like the non-custodial Osmosis exchange on Cosmos, a notable departure from Bitcoin’s underdeveloped on-chain ecosystem.
Thus, we believe this integration will enhance Bitcoin’s utility, making it more exciting for users while also bolstering Cosmos’ liquidity by leveraging the substantial value of Idle BTC, amounting to billions of dollars. That said, our optimism is cautious as Bitcoin’s comparable synthetic assets, like BTC.b on Avalanche and WBTC have underperformed when it comes to traction. BTC.b has averaged around ~$3M in average daily volume during the summer, while WBTC recorded an average of at least ~$30M over the same period; thus, its expected level of adoption remains to be seen.
Coinbase’s anticipated integration of the Lightning Network is also set to bolster Bitcoin’s role in payments. This move by one of the largest exchanges globally can significantly increase Lightning Network’s capacity, facilitating quicker and more cost-effective BTC transactions, crucial for Bitcoin’s broader payment utility. Although the lightning channel capacity has been on a downtrend since July due to several entities withdrawing their liquidity, its recent resurgence driven by the Lightning network-integrated taproot upgrade is reassuring. Finally, despite Bitcoin’s volatility as a medium of exchange, the asset has demonstrated its effectiveness in hedging against counterparty risks, particularly evident during this year’s banking failures, unlike fiat-backed stablecoins.
Figure 6: Bitcoin Scaling Solution (Lightning Network) Capacity
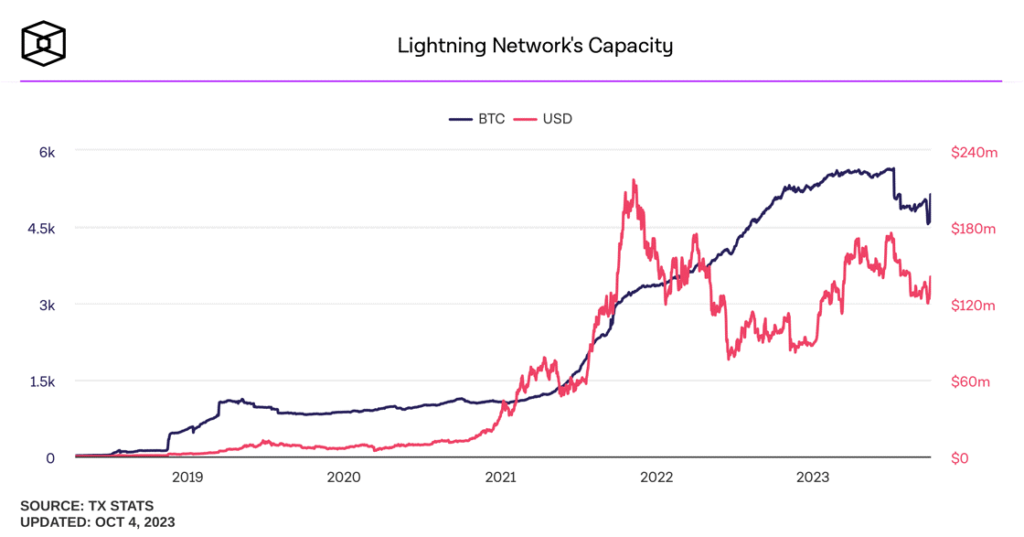
Source: The Block Data
In terms of improved usability, the creator of Ordinals has suggested a new token standard providing more efficient means of implementing fungible tokens on Bitcoin, akin to Ethereum’s ERC20 tokens. While it’s important to note that the proposal is in its early stages, the innovation has the potential to generate excitement similar to what we saw earlier with the introduction of the BRC20 standard, significantly impacting Bitcoin’s miner revenue and boosting the network’s security in the process.
Finally, rising macro uncertainty due to the nearly-averted US government shutdown, sticky inflation, and debt ceiling debates, has sparked renewed investor interest in hedging against counterparty and monetary debasement risks. We anticipate this sentiment to persist, evident in significant funds flowing ($20M) into Bitcoin ETFs—four times more volume than all other assets over the last week, combined with Bitcoin’s decreasing correlation with equities and gold. Further, the growing demand for Bitcoin can be equally observed in the network’s increasing fees, which are now surpassing transaction costs on Ethereum, and driven by the network’s rising on-chain volume.
Figure 7: Comparison of transaction fees between Bitcoin vs. Ethereum
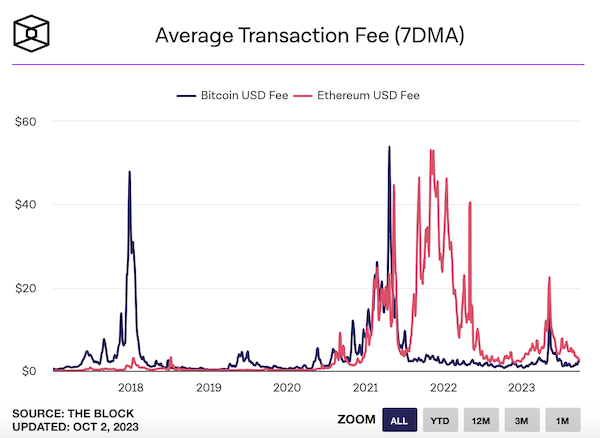
Source: The Block Data
Tokenization, The Revival of Solana’s Growth Potential
Solana witnessed a series of key developments that we anticipate will drive user adoption. First, Visa announced it’ll expand its stablecoin settlement capabilities to the Solana blockchain. In Collaboration with merchant service providers Worldpay and Nuvei, the payments giant will now allow merchants to send and receive USDC. This move is not only expected to improve fund transfers between banks and merchants but also has the potential to greatly reduce cross-border settlements through Solana’s economic network. Visa typically incurs processing costs ranging from 1.15% + $0.05 to 2.40% + $0.10, whereas Solana averages ~$0.000125, highlighting the potential for significant cost reduction.
Visa’s decision comes after Shopify partnered with Solana Pay, enabling USDC settlements on Solana. We believe such Integrations could revive the network’s on-chain activity, capitalizing on stablecoins’ dominant role within the crypto market, which is relevant in light of Solana’s bottoming-out daily active users. It’s also worth noting that Ethereum nearly matched Visa’s settlement volume in Q1 of 23 by processing $3.01T vs. $3.04T, emphasizing stablecoins’ significant impact on blockchain activity and their potential in helping Solana’s recovery while showcasing the role crypto’s railways can play in enhancing global payments. Finally, Ethereum hosts $65B worth of stablecoins, while Solana is at $1.5B. The stark contrast shows the immense room for growth that Solana could have within the stablecoin sector.
Figure 8: Number of Active Addresses on Solana
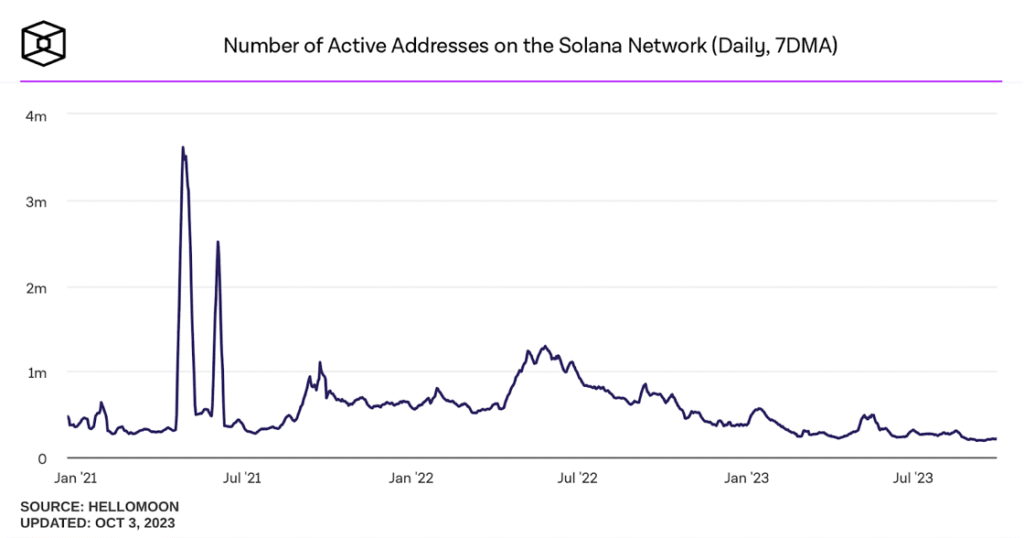
Source: The Block Data
In a similar vein, Solana is seeing a surge in ultra-low cost NFT minting thanks to a new protocol called Bubblegum which compresses the minting process. For reference, an 86K collection can be airdropped to users for around $100 using Solana, compared to close to $200K on Ethereum. While the current NFT use cases aren’t the goal, they’ll be pivotal as they form the foundation for tokenizing unique real world assets like certificates, health records and real estate, amongst others.
As a point of comparison, the current tokenization market is saturated with protocols facilitating access to US treasuries, predominantly relying on fungible tokens rather than NFTs. Conversely, the tokenized real estate sector places significant reliance on NFTs due to their unique properties. Despite being at a nascent phase, the real estate sector already showcases a market capitalization of approximately $230M on Ethereum, with growth predictions that the nascent sector in the US, in its totality, reaches $13.53B by 2030. This underscores the growth potential for Solana and the substantial market share it could capture. Consequently, we foresee Solana taking on an expanded role within the tokenization realm, capitalizing on the maturation of the innovation and the ongoing evolution of regulatory clarity surrounding this asset class.
Figure 9: Weekly NFT creations using Solana’s cost-effective protocol (BubbleGum)
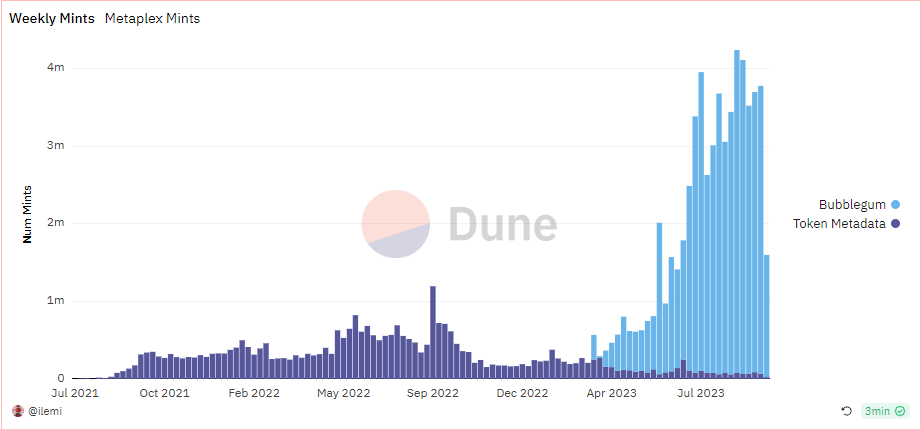
Source: Ilemi on Dune
That said, the performance of the SOL token has not mirrored the network’s improved fundamentals. One factor casting doubt is the fact that FTX holds a significant amount of SOL tokens, amounting to ~$1.16B, according to the latest court filings, which could constitute significant selling pressure. That said, the FTX estate is proposing to cap the selling at $100M worth of all tokens per week, in collaboration with Galaxy Digital, to avoid impacting the market. The selling limit is important as SOL requires roughly ~$2M to drag its price down by 2% on the most liquid exchanges, in the current constrained liquidity conditions. Nevertheless, we believe Solana is a network to be monitored as its increasing role in payments and tokenization may contribute to its resurgence.
Figure 10: FTX Holdings
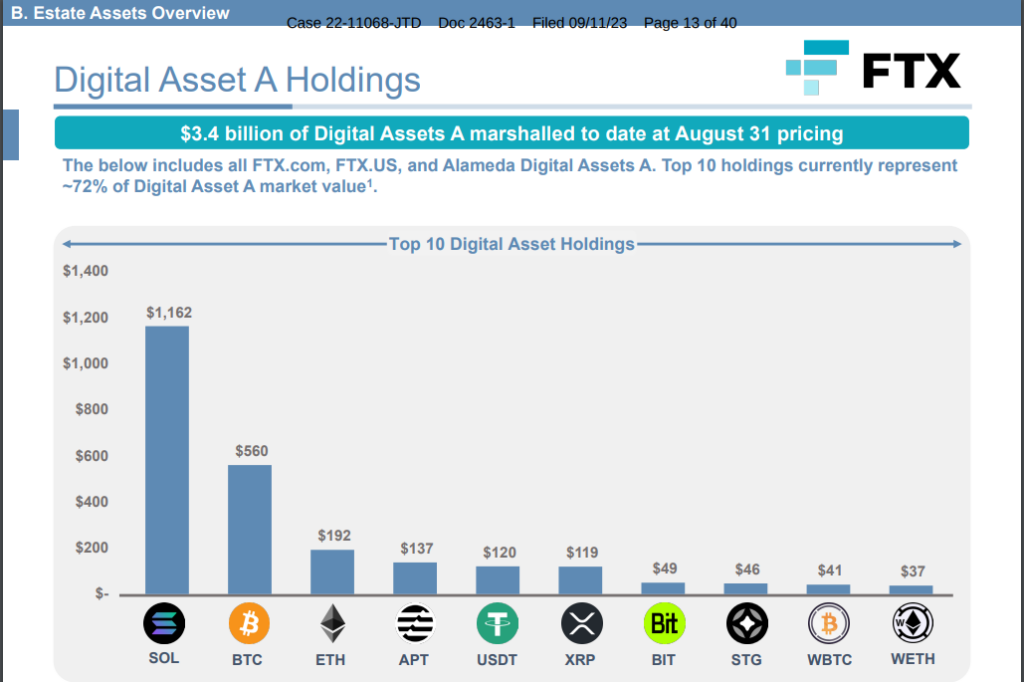
Source: Court Filing. Submitted September 11, 2023
Bookmarks
• Research Analyst Carlos Gonzalez Campo wrote an op-ed for Henley & Partners on crypto valuation as part of their Crypto Wealth Report series.
• Check out the last episode of our very own Inside Crypto, where Gurjeet Kundi, the Managing Director and Head of Trading at 21co, walks us through the core infrastructure behind 21co’s brand new wrapped tokens.
• We’ve published a dashboard tracking the holdings of cybercrime North Korean unit Lazarus Group.
• We’ve also updated our Friend.tech dashboard, tracking its adoption and revenue metrics.
Next Month’s Calendar
These are the top events we’re closely monitoring in October.
• 11th of October: Federal Reserve meeting on the economic outlook
• 12th of October: September’s Inflationary data (CPI)
• 20th of October: The window for public comments on NYDFS closes
• By the end of October: Stacks next major upgrade introducing trustless, two-way Bitcoin peg facilitated by sBTC
Source: 21shares, Forex Factory, CoinMarketCap
Research Newsletter
Each week the 21Shares Research team will publish our data-driven insights into the crypto asset world through this newsletter. Please direct any comments, questions, and words of feedback to research@21shares.com
Disclaimer
The information provided does not constitute a prospectus or other offering material and does not contain or constitute an offer to sell or a solicitation of any offer to buy securities in any jurisdiction. Some of the information published herein may contain forward-looking statements. Readers are cautioned that any such forward-looking statements are not guarantees of future performance and involve risks and uncertainties and that actual results may differ materially from those in the forward-looking statements as a result of various factors. The information contained herein may not be considered as economic, legal, tax or other advice and users are cautioned to base investment decisions or other decisions solely on the content hereof.


Nyheter
HANetf och Infrastructure Capital Advisors samarbetar för att lansera aktivt förvaltad preferensavkastnings-ETF i Europa


HANetf och Infrastructure Capital Advisors samarbetar för att lansera aktivt förvaltad preferensavkastnings-ETF i Europa

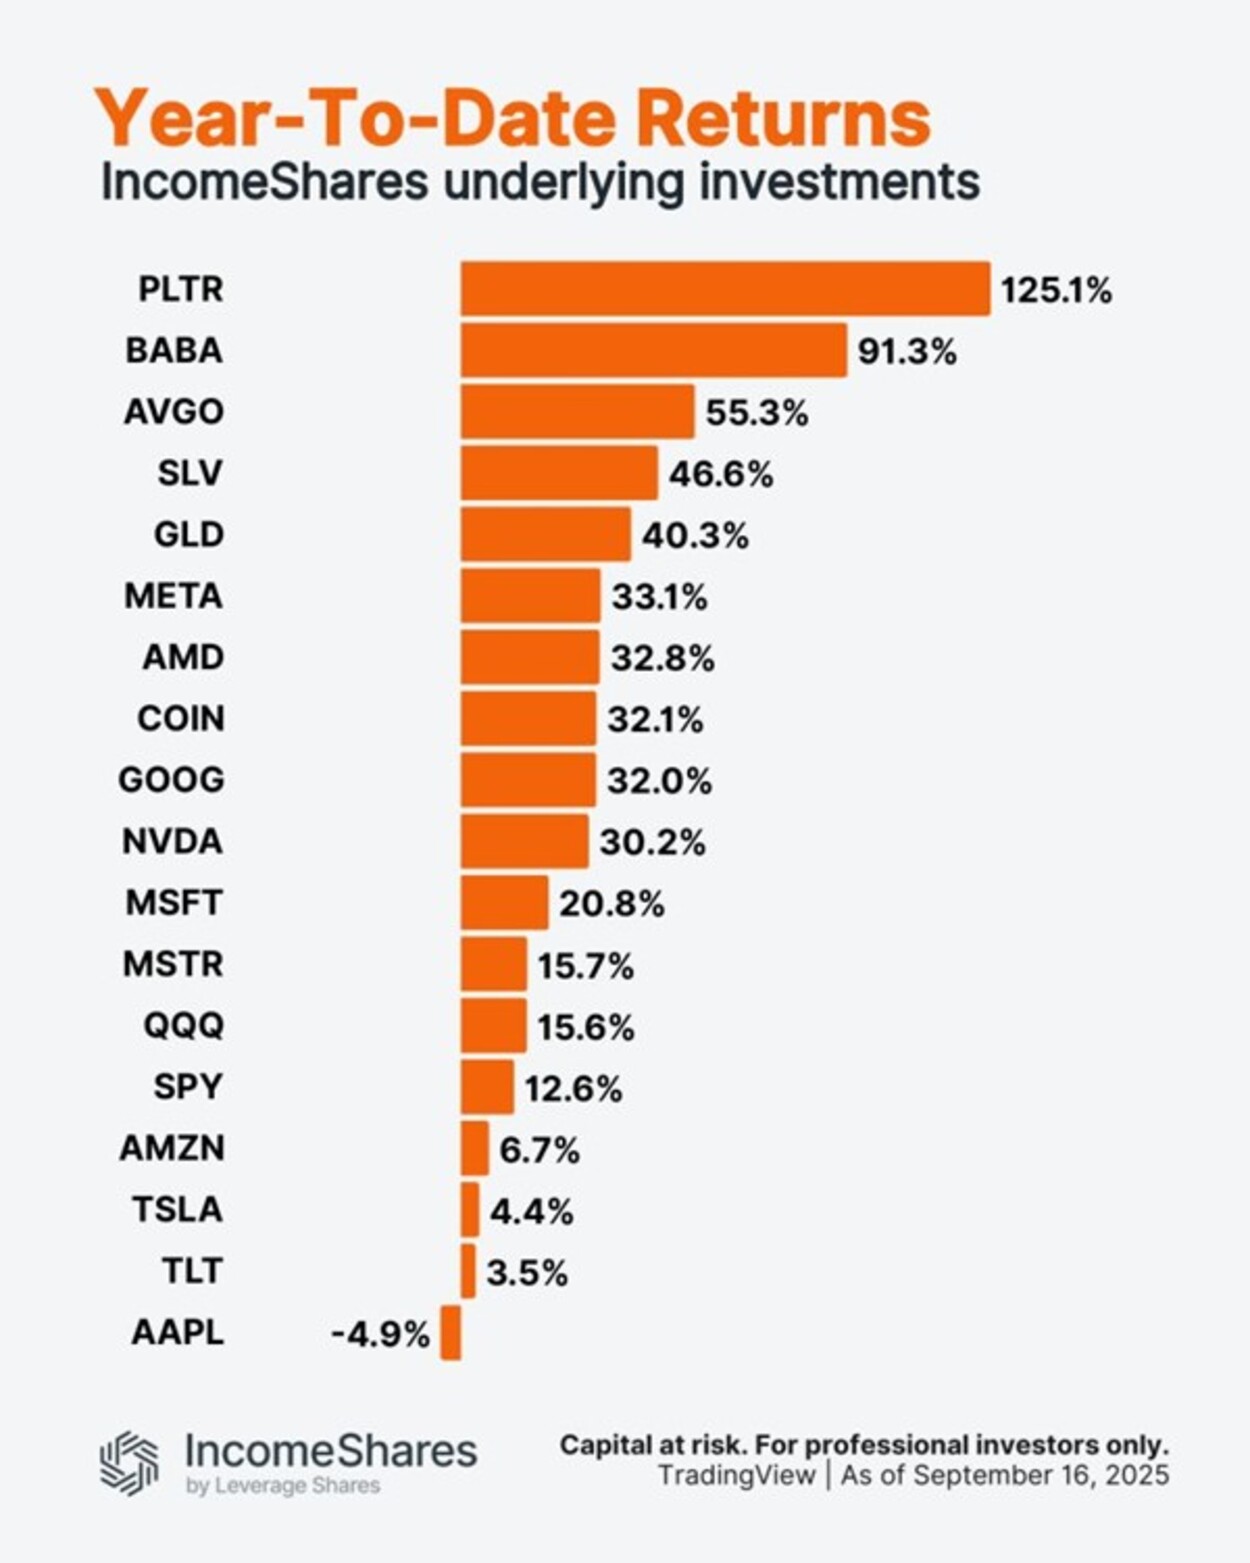
Palantir är upp 125 % i år. Apple är ner 5 %.

Utforska framtiden för AI och DeFi

ONCC ETP spårar den schweiziska dagslåneräntan

HANetf kommenterar kopparuppgången

Utdelningar och försvarsfonder lockade i augusti

Månadsutdelande ETFer uppdaterad med IncomeShares produkter

HANetfs analyserar hur ett fredsavtal kan påverka det europeiska försvaret

ADLT ETF investerar bara i riktigt långa amerikanska statsobligationer

Septembers utdelning i XACT Norden Högutdelande
-
 Nyheter3 veckor sedan
Utdelningar och försvarsfonder lockade i augusti
-
 Nyheter4 veckor sedan
Månadsutdelande ETFer uppdaterad med IncomeShares produkter
-
 Nyheter4 veckor sedan
HANetfs analyserar hur ett fredsavtal kan påverka det europeiska försvaret
-
 Nyheter4 veckor sedan
ADLT ETF investerar bara i riktigt långa amerikanska statsobligationer
-
 Nyheter2 veckor sedan
Septembers utdelning i XACT Norden Högutdelande
-

 Nyheter3 veckor sedan
Fastställd utdelning i MONTDIV augusti 2025
-

 Nyheter2 veckor sedan
HANetf kommenterar mötet mellan Kina, Ryssland och Nordkorea vid militärparad
-

 Nyheter4 veckor sedan
AICT ETF investerar i obligationer utgivna av företag från tillväxtmarknader