
Nyheter
The Biggest Battle-Test for Stablecoins
May ended with the market cap of the entire cryptoassets market resisting at $1.38T down from $1.82T since April. Between panic sellers and ”hodlers,” returning to the fundamentals has been our main thesis that resonates especially during challenging times. In this monthly review, we will delve deeper into the macroeconomic factors driving these drops and showcase some valuable onchain metrics indicating healthy fundamentals. We will also shed light on Terra’s collapse, what led to it, and the repercussions that followed. Moreover, this report will cover the month’s most significant developments on the regulatory landscape, DeFi, and the wider metaverse.
Our Research Team has been exploring onchain indicators such as the Net Unrealized Profit/Loss (NUPL), revealing that investors who bought Bitcoin 1-2 years ago represent over 30% of the selling pressure. In the last bear market, they were representing over 40%. In this section, we’ll walk you through a few indicators our team found insightful this month.
Correlation Matrix
In Figure 1, we can observe that the correlation coefficient between BTC, ETH, and equities, namely the S&P 500 (SPY) and Nasdaq (QQQ), has been increasing consistently over the years. Simultaneously, Gold’s (GLD) correlation to these assets has decreased from very low to negative.
Figure 1 – Asset Correlation Matrix (Multiple Time Horizons)
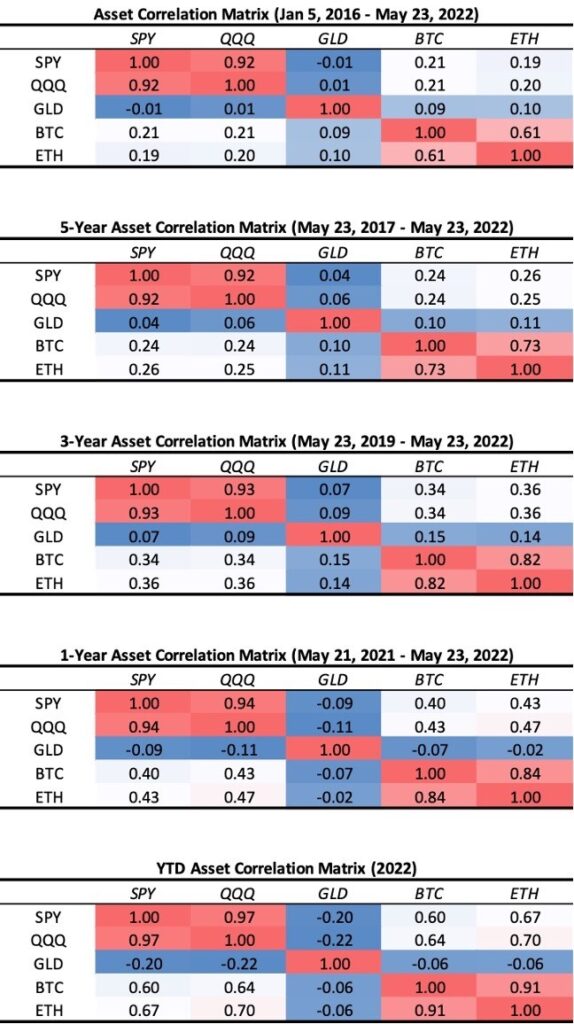
The red color means higher correlation among assets, blue color means lower or negative correlation among assets. Lower or negatively correlated assets have diversification benefits that could improve portfolio risk-adjusted returns.
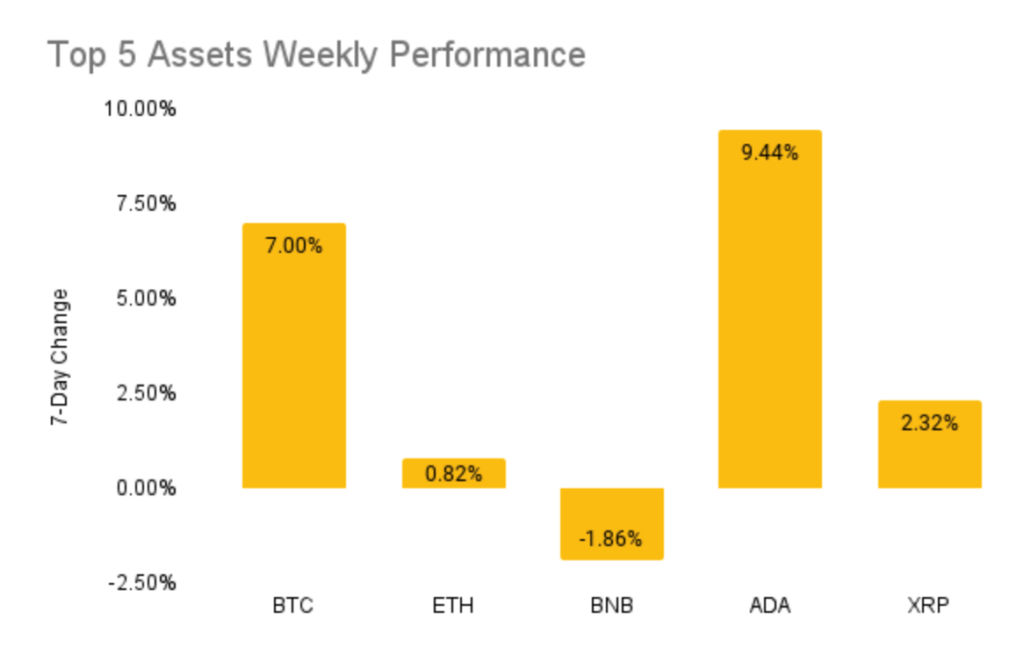
Weekly Returns
The returns of the top five cryptoassets over the last week were as follows — BTC (7%), ETH (0.82%), BNB (-1.86%), ADA(9.44%), XRP (2.32%)
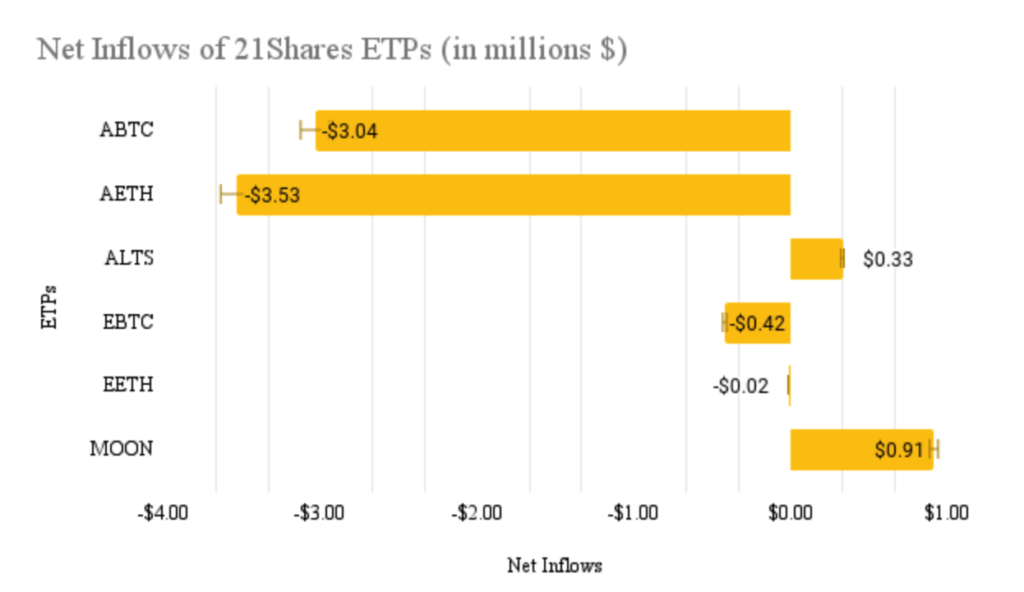
Net Inflows per 21Shares ETP
The net outflows of our ETPs amounted to $6.75M in the past week. Find the breakdown of the inflows and outflows per ETP below.
State of Crypto is Out!
We are thrilled to share that our 6th edition of State of Crypto has finally seen the light; this time around we discuss the portfolio allocation of cryptoassets. The report overviews industry happenings over the past few months and provides data on optimizing portfolio allocation for various risk profiles and portfolio strategies based on crypto-native indicators, sourced from the blockchain.
Get your ex
Research Newsletter
Each week the 21Shares Research team will publish our data-driven insights into the crypto asset world through this newsletter. Please direct any comments, questions, and words of feedback to research@21shares.com
Disclaimer
The information provided does not constitute a prospectus or other offering material and does not contain or constitute an offer to sell or a solicitation of any offer to buy securities in any jurisdiction. Some of the information published herein may contain forward-looking statements. Readers are cautioned that any such forward-looking statements are not guarantees of future performance and involve risks and uncertainties and that actual results may differ materially from those in the forward-looking statements as a result of various factors. The information contained herein may not be considered as economic, legal, tax or other advice and users are cautioned to base investment decisions or other decisions solely on the content hereof.


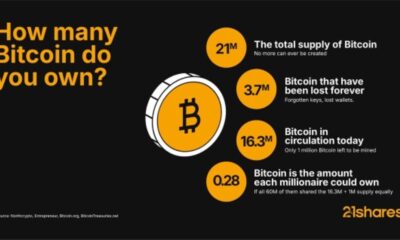

Even buying Bitcoin at its yearly peak since 2020 would still have doubled your investment, proving the power of long-term growth versus trying to time the market.


Why Solana matters: Exploring its use cases and growing adoption
Solana’s surge isn’t just market speculation; it’s driven by real-world adoption. From payments and DeFi to tokenization, the blockchain is seeing record engagement, reflected in its all-time high total value locked (TVL).


How Raydium and Jupiter are powering Solana DeFi
Raydium and Jupiter are the pillars of Solana’s DeFi ecosystem, delivering deep liquidity, seamless trading, and efficient execution that keep the network thriving. They make crypto markets faster, cheaper, and more accessible for everyone.


Research Newsletter
Each week the 21Shares Research team will publish our data-driven insights into the crypto asset world through this newsletter. Please direct any comments, questions, and words of feedback to research@21shares.com
Disclaimer
The information provided does not constitute a prospectus or other offering material and does not contain or constitute an offer to sell or a solicitation of any offer to buy securities in any jurisdiction. Some of the information published herein may contain forward-looking statements. Readers are cautioned that any such forward-looking statements are not guarantees of future performance and involve risks and uncertainties and that actual results may differ materially from those in the forward-looking statements as a result of various factors. The information contained herein may not be considered as economic, legal, tax or other advice and users are cautioned to base investment decisions or other decisions solely on the content hereof.


Time in Bitcoin beats timing Bitcoin

WMMV ETF en lågvolatilitetsfond som handlas i euro och pund
UBS AM lanserar UBS Treasury Yield Plus ETFer
COINUNI ETP spårar kryptovalutan Uniswap

ETF- och ETP-noteringar den 16 september 2025: nytt på Xetra och Börse Frankfurt

Utdelningar och försvarsfonder lockade i augusti

Månadsutdelande ETFer uppdaterad med IncomeShares produkter

HANetfs analyserar hur ett fredsavtal kan påverka det europeiska försvaret

ADLT ETF investerar bara i riktigt långa amerikanska statsobligationer

Septembers utdelning i XACT Norden Högutdelande
-
 Nyheter3 veckor sedan
Utdelningar och försvarsfonder lockade i augusti
-
 Nyheter3 veckor sedan
Månadsutdelande ETFer uppdaterad med IncomeShares produkter
-
 Nyheter4 veckor sedan
HANetfs analyserar hur ett fredsavtal kan påverka det europeiska försvaret
-
 Nyheter4 veckor sedan
ADLT ETF investerar bara i riktigt långa amerikanska statsobligationer
-
 Nyheter2 veckor sedan
Septembers utdelning i XACT Norden Högutdelande
-

 Nyheter3 veckor sedan
Fastställd utdelning i MONTDIV augusti 2025
-

 Nyheter2 veckor sedan
HANetf kommenterar mötet mellan Kina, Ryssland och Nordkorea vid militärparad
-

 Nyheter3 veckor sedan
AICT ETF investerar i obligationer utgivna av företag från tillväxtmarknader