
Nyheter
Spelar priset på en ETF någon roll?

ETFer som följer samma index kan ha väldigt olika priser, men vad säger priset på en ETF dig egentligen? Marknadspriset för en börshandlad fond är en realtidsreflektion av utbud och efterfrågan på dess andelar under hela dagen. Spelar då priset på en ETF någon roll?
Men varför handlas ETFer som spårar samma index till väldigt olika priser? Är iShares Core FTSE 100 UCITS ETF ett skrikande fynd till £7,31* per aktie jämfört med Vanguard FTSE 100 UCITS ETF till £32,80 per aktie? Borde inte båda ETFerna handlas för £7,36 per aktie om indexet är på 7368,17?
Det är ETFens utveckling som räknas
Även om det verkar konstigt, är marknadspriset på en ETF långt ner på listan över prioriteringar när du jämför konkurrerande produkter. Det beror på att en ETFs värde inte definieras av dess marknadspris, till skillnad från med enskilda företagsaktier.
Det som spelar roll är den procentuella förändringen i ETF-priset. Det finns varken här eller där om du köper 60 aktier i en ETF för 2 000 GBP eller 30 aktier för 2 000 GBP. Om ETFen går upp 10 procent, kommer värdet på ditt innehav att vara värt 2 200 pund i båda fallen.
Priset på en ETF kommer vanligtvis att motsvara dess nettotillgångsvärde (NAV). NAV är lika med värdet av ETFens värdepapper och andra tillgångar, minus dess skulder, dividerat med dess antal aktier:
NAV beräknas av ETFens oberoende förvaringsinstitut en gång om dagen.
• Om värdet på en ETFs underliggande tillgångar stiger, och antalet aktier förblir oförändrat, kommer även priset per aktie att öka.
• Om handelsefterfrågan på en ETFs aktier ökar, skapas fler enheter. Det ökade utbudet av aktier håller aktiekursen i linje med ETFens NAV.
Det är värdet av ETFs underliggande index som ska avgöra resultatet för en ETF, inte utbud och efterfrågan på dess aktier. Skapandet och inlösenprocessen säkerställer att en ETFs marknadspris följer dess index nära. Rivalerande ETFer som följer samma index kommer sannolikt att visa nästan identiska procentuella förändringar i pris. Ju närmare dessa förändringar är indexets faktiska resultat, desto bättre gör en ETF sitt jobb.
Exakt ETF-jämförelse
Ibland ser en ETFs pris högt ut eftersom det inkluderar värdet av utdelningar som har återinvesterats automatiskt istället för att delas ut till investerare. Dessa typer av fonder kallas för ackumulerande eller kapitaliserande fonder.
Priset på en utdelande ETF sjunker i takt med det belopp som betalas ut till investerare, medan en ackumulerande ETF kommer att höja sitt pris i linje med värdet på de behållna utdelningarna. Under åren kommer det att leda till en stor prisskillnad mellan två annars identiska ETFer – men det är en prisskillnad inte en prestationsskillnad.
I diagrammet nedan kan du se att det övergripande resultatet är mycket lika under 5 år mellan iShares EURO STOXX 50 UCITS ETF (Dist) och Source EURO STOXX 50 UCITS ETF (Accumulating).
Jämförelse av iShares EURO STOXX 50 UCITS ETF (Dist) och Source EURO STOXX 50 UCITS ETF A
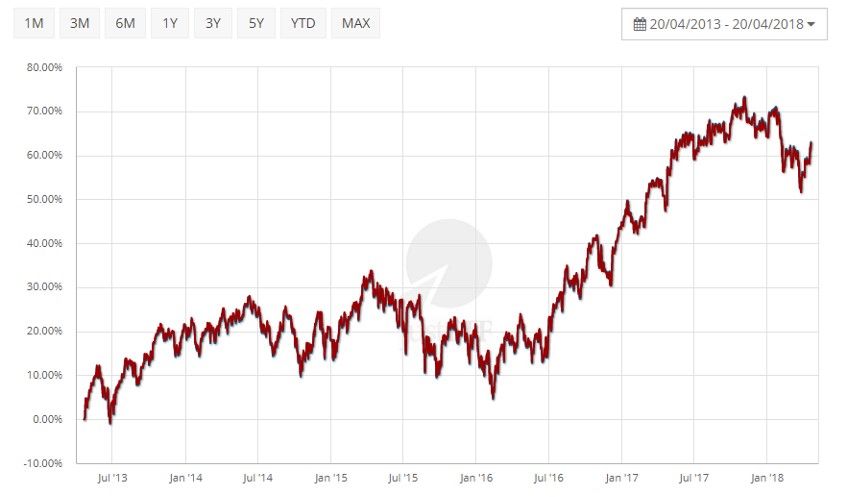
Source EURO STOXX 50 UCITS ETF A och iShares EURO STOXX 50 UCITS ETF (Dist)
iShares ETF:s aktiekurs är £31,04* medan Source ETF:s aktiekurs är £62,88.* (Värde per den 20 april 2018).
Det är dock deras prestanda kontra indexet som räknas, så våra diagram beräknar avkastningen på en ”återinvesterad utdelning” för att möjliggöra en jämförelse mellan äpplen och äpplen.
Detta hjälper till att förklara varför priset inte är en viktig faktor jämfört med variabler som kostnad och spårningsskillnad. Du kan ta reda på mer om hur du väljer de bästa ETF:erna i vår akademipost.
Lägre ETF-priser kan vara bekvämare
Fördelen med lägre aktiekurser är att de kan göra portföljförvaltningen lite enklare. En hög aktiekurs kan innebära att du inte kan köpa exakt det antal aktier du vill, speciellt när du bidrar med månatliga summor under 1 000 £.
Tabellen nedan visar varför ett lägre pris kan hjälpa. Du kan inte köpa delar av ETF-aktier, så ett högre pris kan lämna dig med mer pengar vid sidan av:
FTSE 100 ETF ‘A’ @ £37 per aktie
| Belopp | ETF pris | Antal andelar | Oinvesterat | % oinvesterat |
| £200 | £37 | 5 | £15 | 7.5% |
| £500 | £37 | 13 | £19 | 3.8% |
| £1,000 | £37 | 27 | £1 | 0.1% |
| £2,500 | £37 | 67 | £21 | 0.8% |
FTSE 100 ETF ‘B’ @ £3.70 per aktie
| Belopp | ETF pris | Antal andelar | Oinvesterat | % oinvesterat |
| £200 | £3.70 | 54 | £2 | 1.0% |
| £500 | £3.70 | 135 | £0.50 | 0.1% |
| £1,000 | £3.70 | 270 | £1 | 0.1% |
| £2,500 | £3.70 | 675 | £2.50 | 0.1% |
Möjligheten att köpa fler aktier till ett lägre pris innebär att du kan kanalisera dina pengar på marknaden mer effektivt, speciellt om du gillar att automatisera dina bidrag. Forskning visar att det generellt sett är bättre att sätta dina pengar på marknaden så länge som möjligt och lägre priser gör det, och ombalanseringen till din exakta tillgångsallokering, lättare.
• Olika priser är inget att oroa sig för bland ETFer som följer samma index och innehåller inte viktig prestationsrelaterad information.
• Lägre priser gör att du kan investera mer effektivt och finjustera din portföljförvaltning.


Nyheter
HANetf och Infrastructure Capital Advisors samarbetar för att lansera aktivt förvaltad preferensavkastnings-ETF i Europa


HANetf och Infrastructure Capital Advisors samarbetar för att lansera aktivt förvaltad preferensavkastnings-ETF i Europa

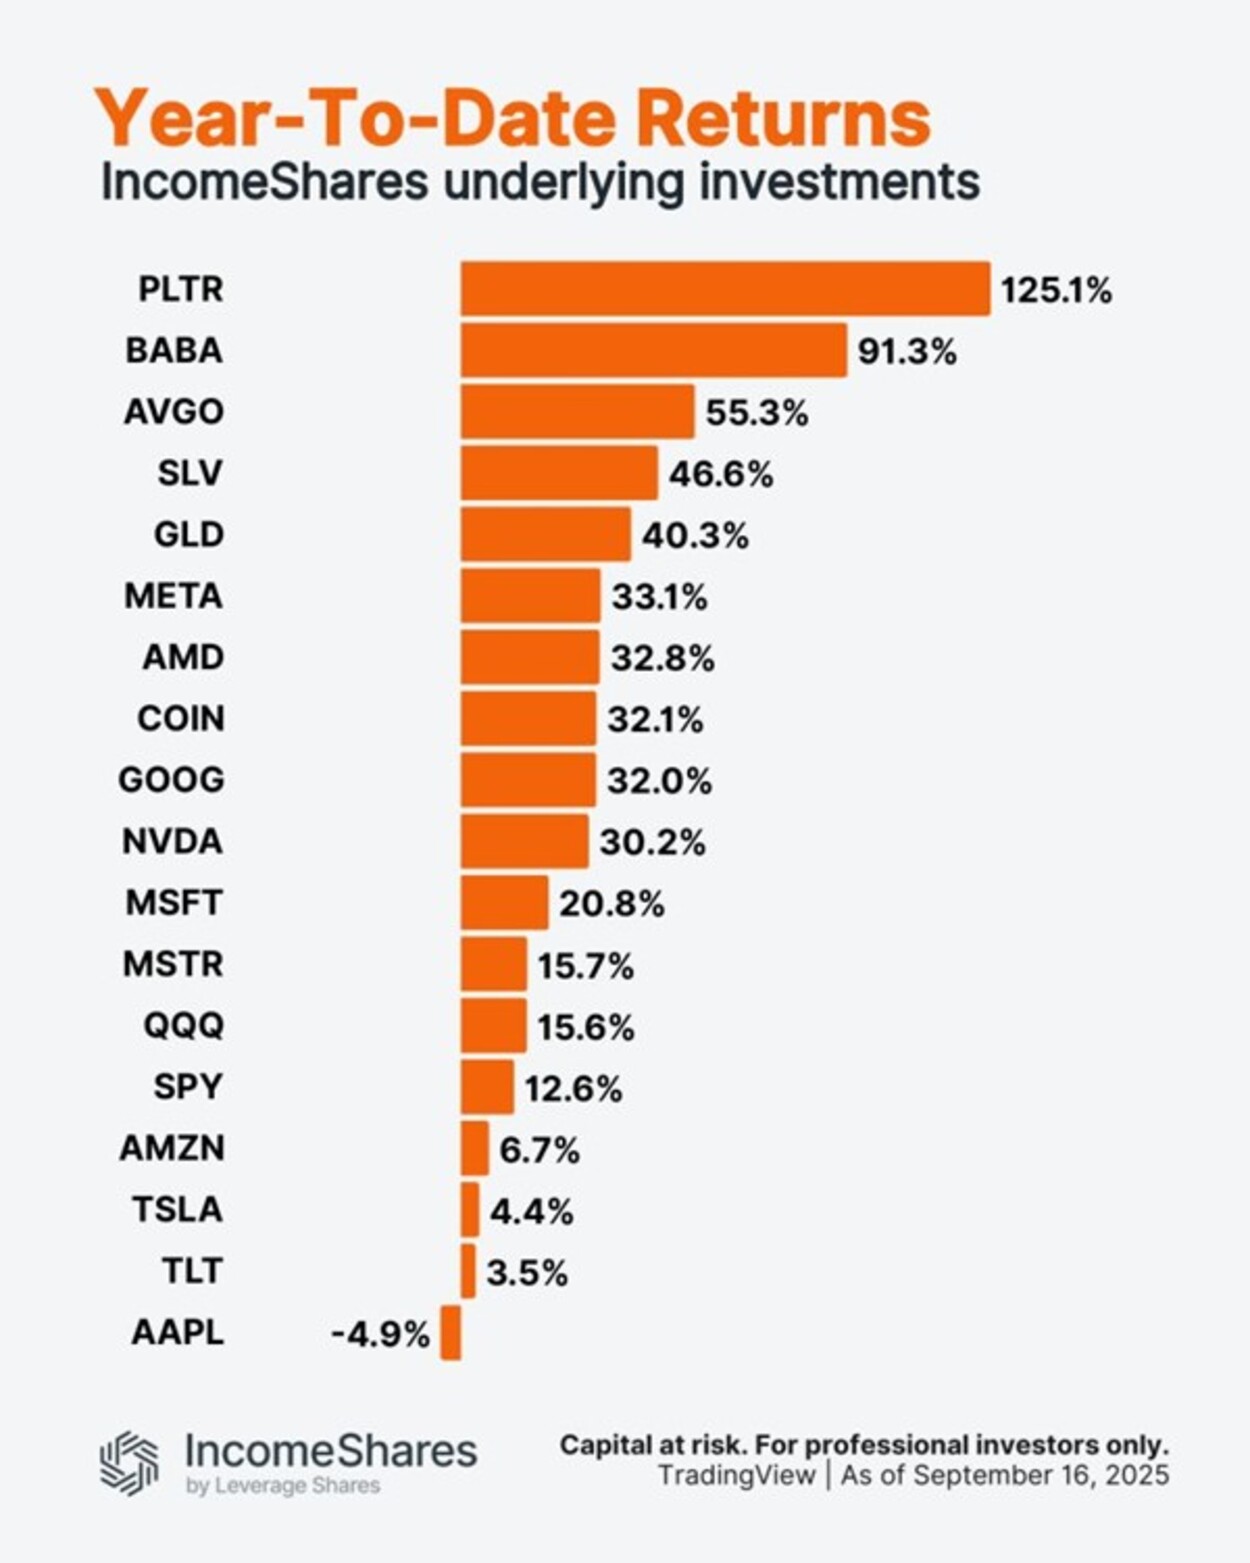
Palantir är upp 125 % i år. Apple är ner 5 %.

Utforska framtiden för AI och DeFi

ONCC ETP spårar den schweiziska dagslåneräntan

HANetf kommenterar kopparuppgången

Utdelningar och försvarsfonder lockade i augusti

Månadsutdelande ETFer uppdaterad med IncomeShares produkter

HANetfs analyserar hur ett fredsavtal kan påverka det europeiska försvaret

ADLT ETF investerar bara i riktigt långa amerikanska statsobligationer

Septembers utdelning i XACT Norden Högutdelande
-
 Nyheter3 veckor sedan
Utdelningar och försvarsfonder lockade i augusti
-
 Nyheter4 veckor sedan
Månadsutdelande ETFer uppdaterad med IncomeShares produkter
-
 Nyheter4 veckor sedan
HANetfs analyserar hur ett fredsavtal kan påverka det europeiska försvaret
-
 Nyheter4 veckor sedan
ADLT ETF investerar bara i riktigt långa amerikanska statsobligationer
-
 Nyheter2 veckor sedan
Septembers utdelning i XACT Norden Högutdelande
-

 Nyheter3 veckor sedan
Fastställd utdelning i MONTDIV augusti 2025
-

 Nyheter2 veckor sedan
HANetf kommenterar mötet mellan Kina, Ryssland och Nordkorea vid militärparad
-

 Nyheter4 veckor sedan
AICT ETF investerar i obligationer utgivna av företag från tillväxtmarknader