Palladium’s outperformance is tied to a confluence of reasons – the ‘Dieselgate’ scandal, strong auto demand and speculative buying interest. However this is unsustainable.
Accelerating growth in the European auto sector should offset the gradual decline in diesel cars market share, supporting platinum’s demand. Platinum – More uncertainty than opportunity.
Platinum’s sustainable long term price recovery is rooted in meaningful production cuts.
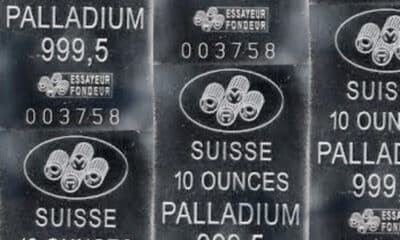
Palladium has rallied 43% in 2017, marking the strongest performance within the commodity complex. It has surpassed its counterpart platinum for the first time in 16 years. The price movement of platinum and palladium has historically been in sync since the majority of their use is derived by catalytic converters used in gasoline and diesel vehicles respectively.
Net Balance vs Ratio
The last time we witnessed a similar price outperformance by palladium was in 2000, triggered by supply disruptions in Russia. While the Russian government’s threat to stop selling palladium never materialised, it certainly prompted a fear of a supply deficit amplifying palladium’s price surge. It’s worth noting that consequently palladium underperformed platinum for more than eight consecutive years.
‘Dieselgate’ lifted palladium higher
Demand for platinum suffered a setback after the emissions scandal sparked by Volkswagen two years ago dented investor sentiment towards the precious metal. Data from the European Automobile Manufacturers Association (ACEA) has revealed in H1 2017 that sales of gasoline powered cars in Europe surpassed diesel powered cars for the first time since 2009. The share of diesel cars declined by 3.8% YTD (year-to-date) while gasoline cars rose by 10% YTD. In France, gasoline cars are currently dominating market share contrary to its historical 70% ownership of diesel cars. In addition the rising demand for relatively larger gasoline cars, which contain larger motors, combined with stricter emission standards has increased the loading requirements of palladium. This shift in consumer preferences in size and category of cars had a strong role to play in the recent divergence of performance between the two precious metals. That being said, auto sales in US and China, known for driving gasoline cars are softening and its effect could limit palladium’s upside in the near term.
Global auto sales growth
European auto demand bullish for platinum
Auto sales in Europe (dominated by diesel cars) are gaining momentum. Since the decline in diesel market share will be a gradual ongoing process, platinum demand will remain well supported. In addition as new emission standards in Europe intensify, platinum’s price recovery over the medium term remains well supported.
Platinum is known to be about twice as effective as palladium in catalytic convertors. The potential for substitution between the two precious metals is reliant on whether fabricators perceive platinum’s current price discount to palladium to persist for a substantial period. Furthermore supply shortage concerns of palladium (deficit predicted in 2018) in the long term could also be a cause for substitution away from palladium. Speculative interest unlikely to last
Palladium’s outperformance to a large extent can be attributed to speculative buying interest encouraged by the bullish backdrop for palladium. The first week of June witnessed a surge in the lease rate to borrow palladium from 3.5% to 16%, underscoring the shortage of palladium in the market. There is evidence that the strong buying interest from Asia overwhelmed the relatively small market. The palladium market is the smallest and least liquid market among the four tradable precious metals and remains vulnerable to sharp price swings caused by sudden speculative flow of money.
Palladium Imports vs Inventory
The forward curve of precious metals generally tends to be in contango (future price higher than current price). However palladium’s forward curve has been in backwardation for almost nine months, illustrating the tightness in the market. While contango is the cost of holding a commodity, backwardation is a benefit.
That being said, the slope of the backwardated palladium curve is allowing speculators to buy the lower priced forward contracts and roll up the price curve into the higher spot prices. This has allowed them to lock in a positive roll, which has been extremely attractive in the current low yielding environment. Owing to this, the bulk of demand for palladium is in the present, and that optimism is waning looking forward.
Platinum’s deep discounts support demand
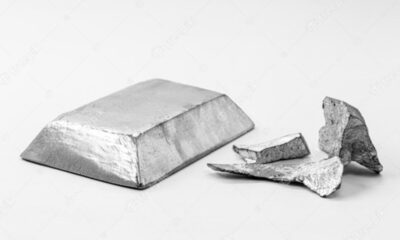
While platinum has historically traded at a significant premium over gold, it’s currently trading at a -28% discount to gold. Platinum is highly correlated to gold, however in this cycle it has only tracked gold’s downward movements and captured very little of the upside. We believe this recent trend could be broken and traditional correlations restored if consumers recognise just how cheap platinum is right now. We expect price sensitive jewellery consumers to switch to the relatively cheap platinum especially as it is gaining further acceptance in key markets like China and India. Given a supportive backdrop of improving economic conditions globally combined with platinum’s relative price attractiveness, we expect demand for platinum to rise. We expect most of the growth to be concentrated in industrial applications – chemicals, glass and electrical (the second largest component at 20% of platinum consumption).
Platinum investment demand is strong
Out of the precious metals, physically-backed platinum ETPs have acquired the highest assets under management since 2012. While palladium has accumulated the least. Platinum’s relative price advantage and lower volatility will be the primary stimulus for the investment sector. Platinum holdings stands to benefit a portfolio by providing protection against inflation and financial asset deflation, while allowing positive upside as industrial demand recovers globally.
Physically backed ETPs
Platinum’s upside tied to supply cuts
Platinum producers in South Africa (known to account for 80% of global output) are struggling, as lower platinum prices and higher fixed costs coupled with weak demand from key segments are straining margins. So far, the miners have not meaningfully reduced production. Efforts to spread fixed costs over a wider output base have resulted in an oversupply. However this is unsustainable. Platinum miner Sibanye recently backed out from its announcement to shutter shafts worth 300koz at its Rustenburg site. Sibanye’s reluctance to shutter mines is illustrative of the unwillingness of producers to make meaningful supply cuts to stimulate prices.
Electric vehicle growth in nascent stage
Demand for electric vehicles (EVs) have been the focal point of future risks facing the platinum and palladium industry. While the auto industry is undergoing a structural shift, away from the internal combustion engine towards battery electric vehicles (BEVs). The reality is the uptake of sales of EVs is likely to be gradual. The reason behind this is the necessary infrastructure – development of batteries and charging stations to facilitate this shift will require a longer time frame than anticipated. China recently announced its intention to delay the enactment of the quota requiring automakers to produce a minimum number of EVs. Consumer acceptance of EVs hinge on extensive public subsidies.
Important Information
General
This communication has been issued and approved for the purpose of section 21 of the Financial Services and Markets Act 2000 by ETF Securities (UK) Limited (“ETFS UK”) which is authorised and regulated by the United Kingdom Financial Conduct Authority (the “FCA”).
The information contained in this communication is for your general information only and is neither an offer for sale nor a solicitation of an offer to buy securities. This communication should not be used as the basis for any investment decision. Historical performance is not an indication of future performance and any investments may go down in value.
This document is not, and under no circumstances is to be construed as, an advertisement or any other step in furtherance of a public offering of shares or securities in the United States or any province or territory thereof. Neither this document nor any copy hereof should be taken, transmitted or distributed (directly or indirectly) into the United States.
This communication may contain independent market commentary prepared by ETFS UK based on publicly available information. Although ETFS UK endeavours to ensure the accuracy of the content in this communication, ETFS UK does not warrant or guarantee its accuracy or correctness. Any third party data providers used to source the information in this communication make no warranties or representation of any kind relating to such data. Where ETFS UK has expressed its own opinions related to product or market activity, these views may change. Neither ETFS UK, nor any affiliate, nor any of their respective officers, directors, partners, or employees accepts any liability whatsoever for any direct or consequential loss arising from any use of this publication or its contents.
ETFS UK is required by the FCA to clarify that it is not acting for you in any way in relation to the investment or investment activity to which this communication relates. In particular, ETFS UK will not provide any investment services to you and or advise you on the merits of, or make any recommendation to you in relation to, the terms of any transaction. No representative of ETFS UK is authorised to behave in any way which would lead you to believe otherwise. ETFS UK is not, therefore, responsible for providing you with the protections afforded to its clients and you should seek your own independent legal, investment and tax or other advice as you see fit.


 Nyheter4 veckor sedan
 Nyheter1 vecka sedan
 Nyheter4 veckor sedan
 Nyheter4 veckor sedan