
Nyheter
Our Monthly Review is Out: Insights from September 2022
The overall cryptoasset market tumbled by almost 5% over the past month to rest at $933.7B. Bitcoin and Ethereum declined by 3% and 14% over the past month. This month’s winners were Solana and Uniswap, which jumped by 6% and 5% respectively. Optimism performed better than its peers within the major L2s in terms of total value locked (TVL). The figure below shows the performance of the top cryptoassets within the major categories, month over month.
Figure 1
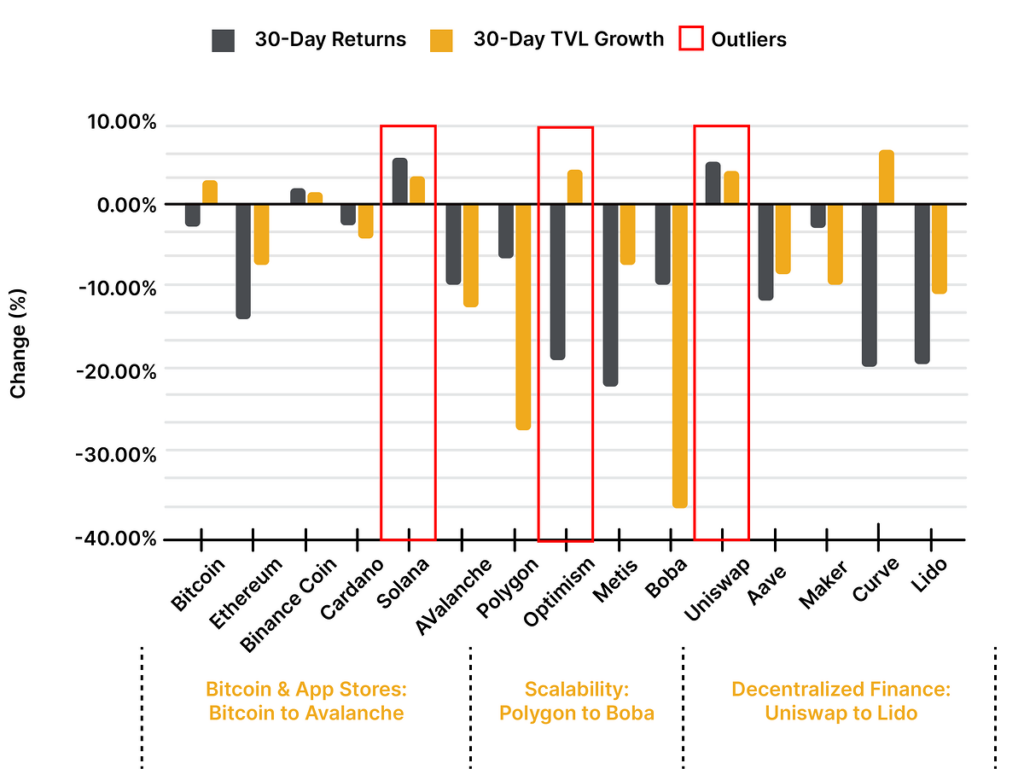
Source: 21Shares, Coingecko, DeFi Llama
Key takeaways from this report
• Bitcoin under-levered for the first time this year
• Stablecoins and proof-of-work mining have been the talk of regulators
• The Merge settled, boosting development in Ethereum’s scalability solutions
• OpenSea and Decentraland introduce innovations to the NFTs industry
Spot and Derivatives Markets
Figure 2
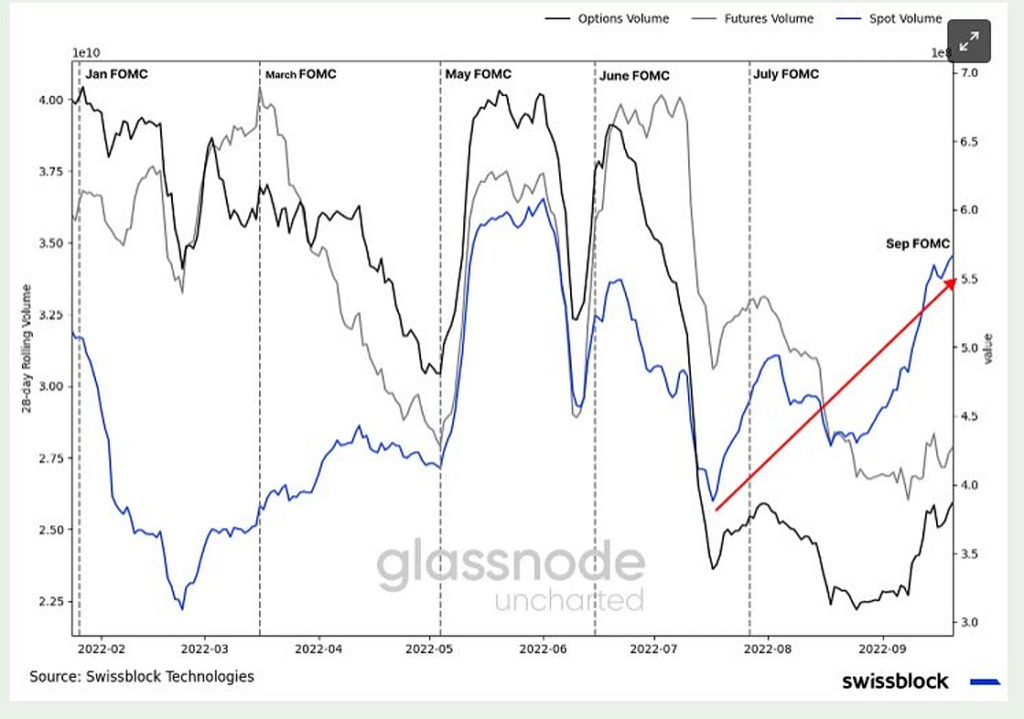
Source: Glassnode, Swissblock Technologies
The figure above plots this year’s meetings of the Federal Open Market Committee (FOMC) against spot and derivatives 28-day rolling volume. The chart reveals that Bitcoin is under-levered for the first time this year, which in itself is a sign of true capitulation.
On-chain Indicators
Figure 3: Ethereum’s NUPL ratio
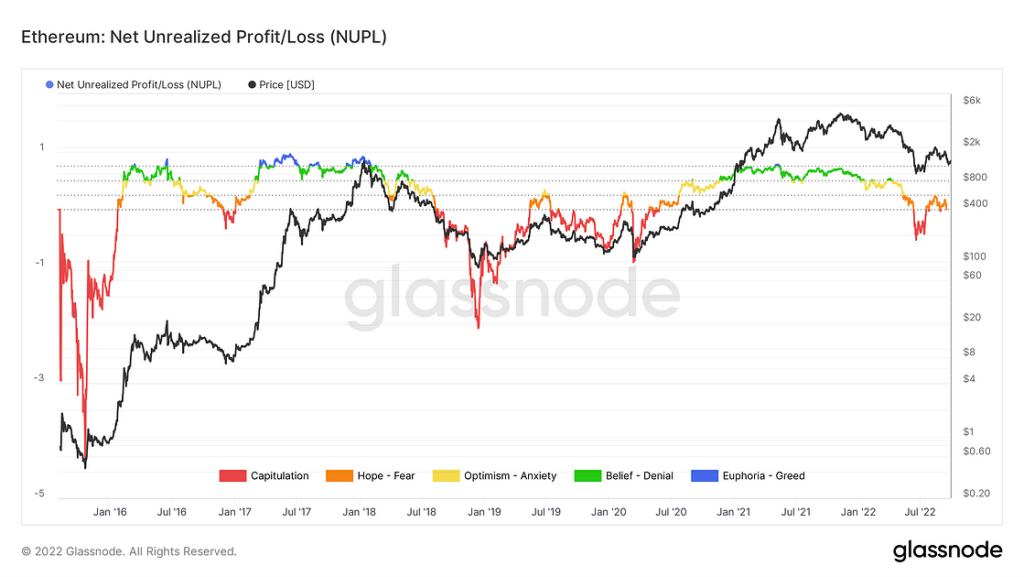
Source: Glassnode
On September 30, Ethereum’s NUPL ratio was at -0.09, which means that the second-largest cryptoasset by market capitalization is still at the capitulation zone. The current level is similar to levels seen in December 2016 when ETH was at $8.4, with a market cap of $626M, a few months before it jumped within the belief and euphoria levels for a little over a year.
Figure 4: Ethereum’s Network Value to Transaction Signal
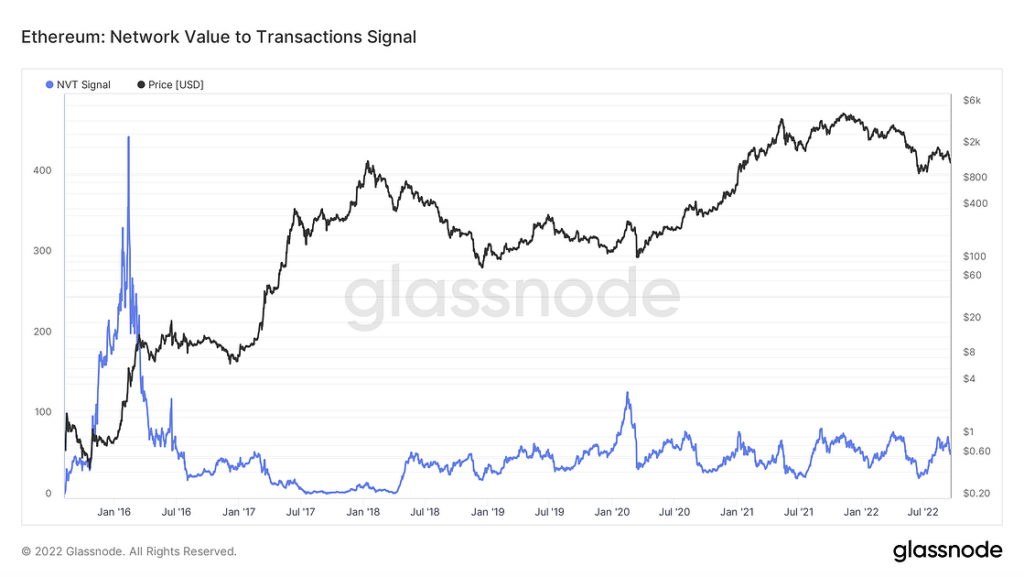
Source: Glassnode
The NVT Signal (NVTS) is a modified version of the original NVT Ratio, using a 90-day moving average for transaction volume instead of the raw daily transaction volume, making it function better as a leading indicator. NVTS in Figure 4 indicates that ETH’s ratio reached the same level as the prior bear market around June 2018. At that time, ETH was valued at $73.9B which is currently 45% of today’s value while the daily number of transactions on the number today is 1.5x as much as the last crypto winter. In other words, ETH value increased significantly more than its fundamentals.
Read full report here
Research Newsletter
Each week the 21Shares Research team will publish our data-driven insights into the crypto asset world through this newsletter. Please direct any comments, questions, and words of feedback to research@21shares.com
Disclaimer
The information provided does not constitute a prospectus or other offering material and does not contain or constitute an offer to sell or a solicitation of any offer to buy securities in any jurisdiction. Some of the information published herein may contain forward-looking statements. Readers are cautioned that any such forward-looking statements are not guarantees of future performance and involve risks and uncertainties and that actual results may differ materially from those in the forward-looking statements as a result of various factors. The information contained herein may not be considered as economic, legal, tax or other advice and users are cautioned to base investment decisions or other decisions solely on the content hereof.


Even buying Bitcoin at its yearly peak since 2020 would still have doubled your investment, proving the power of long-term growth versus trying to time the market.


Why Solana matters: Exploring its use cases and growing adoption
Solana’s surge isn’t just market speculation; it’s driven by real-world adoption. From payments and DeFi to tokenization, the blockchain is seeing record engagement, reflected in its all-time high total value locked (TVL).


How Raydium and Jupiter are powering Solana DeFi
Raydium and Jupiter are the pillars of Solana’s DeFi ecosystem, delivering deep liquidity, seamless trading, and efficient execution that keep the network thriving. They make crypto markets faster, cheaper, and more accessible for everyone.


Research Newsletter
Each week the 21Shares Research team will publish our data-driven insights into the crypto asset world through this newsletter. Please direct any comments, questions, and words of feedback to research@21shares.com
Disclaimer
The information provided does not constitute a prospectus or other offering material and does not contain or constitute an offer to sell or a solicitation of any offer to buy securities in any jurisdiction. Some of the information published herein may contain forward-looking statements. Readers are cautioned that any such forward-looking statements are not guarantees of future performance and involve risks and uncertainties and that actual results may differ materially from those in the forward-looking statements as a result of various factors. The information contained herein may not be considered as economic, legal, tax or other advice and users are cautioned to base investment decisions or other decisions solely on the content hereof.


Time in Bitcoin beats timing Bitcoin

WMMV ETF en lågvolatilitetsfond som handlas i euro och pund
UBS AM lanserar UBS Treasury Yield Plus ETFer
COINUNI ETP spårar kryptovalutan Uniswap

ETF- och ETP-noteringar den 16 september 2025: nytt på Xetra och Börse Frankfurt

Utdelningar och försvarsfonder lockade i augusti

Månadsutdelande ETFer uppdaterad med IncomeShares produkter

HANetfs analyserar hur ett fredsavtal kan påverka det europeiska försvaret

ADLT ETF investerar bara i riktigt långa amerikanska statsobligationer

Septembers utdelning i XACT Norden Högutdelande
-
 Nyheter2 veckor sedan
Utdelningar och försvarsfonder lockade i augusti
-
 Nyheter3 veckor sedan
Månadsutdelande ETFer uppdaterad med IncomeShares produkter
-
 Nyheter4 veckor sedan
HANetfs analyserar hur ett fredsavtal kan påverka det europeiska försvaret
-
 Nyheter4 veckor sedan
ADLT ETF investerar bara i riktigt långa amerikanska statsobligationer
-
 Nyheter2 veckor sedan
Septembers utdelning i XACT Norden Högutdelande
-

 Nyheter3 veckor sedan
Fastställd utdelning i MONTDIV augusti 2025
-

 Nyheter2 veckor sedan
HANetf kommenterar mötet mellan Kina, Ryssland och Nordkorea vid militärparad
-

 Nyheter3 veckor sedan
AICT ETF investerar i obligationer utgivna av företag från tillväxtmarknader