
Nyheter
Mixed Macro Messages and Bitcoin’s Ongoing Battles
This week, all eyes are on the upcoming CPI and PPI data, crucial for gauging US inflation trends. A higher-than-expected reading would signal persistent inflation, likely leading the U.S. Federal Reserve to maintain its high interest rate regime. This outcome would naturally shift investor attention away from cryptoassets, as investors seek the relative safety of fixed-income assets, like U.S. Treasuries. That being said, U.S. inflation does appear to be on a downturn, with GDP decreasing to 1.4% in the first quarter of the year, a rapid deceleration from the end of last year. Growth slowing down is important for prices to be tamed. Last month’s PCE reading also came in at 2.6%, in line with expectations. Furthermore, the latest jobs report highlighted that the total number of Americans collecting unemployment benefits rose for the ninth straight week, reaching 1.86M, the highest level since November 2021! Coupled with unemployment rising to 4.1%, this indicates a labor market slowdown, which could ease inflationary pressures further.
However, global liquidity is falling steeply as shown in Figure 1 below, evidenced by a 13% increase in U.S. repo volume in June. This indicates that financial institutions are turning to collateralized borrowing to secure short-term funds, signaling reduced cash availability and higher borrowing costs. Similarly, in Europe, the EU repo volume crossed over €300B, tightening liquidity conditions further. Less global liquidity means reduced cash flow into risk-on assets, potentially pressuring the crypto market despite dwindling inflationary pressures.
Figure 1 – EU and U.S. Central Bank Balance Sheet
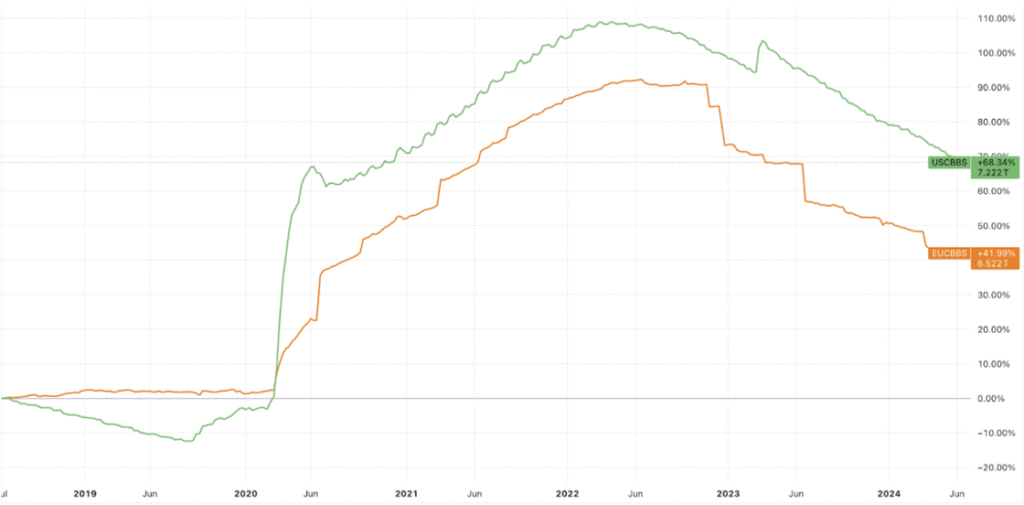
Source: TradingView
Looking within crypto, Bitcoin is currently facing a combination of industry-native factors that are contributing to the recent price decline. The German government has been consistently selling close to 1,000 BTC or almost $58M per day, over the last week, from their seized stash originating from the pirating website Movie2K. This ongoing selling pressure could continue for approximately two to three more weeks until the rest of their holdings standing at 26K BTC are liquidated. Additionally, the Mt. Gox repayment program has commenced, with nearly 47,000 BTC transferred to unidentified wallets that have not made any further moves yet. This indicates that this amount, equating to $2.7B worth of BTC, will be the first stack reimbursed back to creditors.
It’s worth highlighting though that creditors will receive their allocation over multiple days through different exchanges, which should somewhat mitigate the selling pressure. Tax considerations are also another reason why the selling is unlikely to materialize in a short timeframe given the price appreciation that BTC has undergone in the last decade since the exchange’s hack.
That said, Bitcoin’s liquidity appears sufficient to withstand potential selling pressure without significant market impact. Even on the slowest days, the average inflow to exchanges has been around an average of 20K BTC, as shown below in Figure 2. Additionally, it takes approximately 500 BTC on the most liquid exchange, Bitfinex, to cause a 2% drop in BTC price, and an average of 250 BTC on the next three most liquid platforms to produce a similar price movement. Therefore, a 10-15% drawdown seems plausible for the worst-case scenario of creditors selling all their holdings immediately, which we don’t believe will be the case. In addition, individual investors with large amounts could also sell over the counter (OTC) to get a better rate and avoid price slippage, which could further reduce the market impact of their BTC offloading.
Figure 2: Total transfer volume of BTC to exchanges
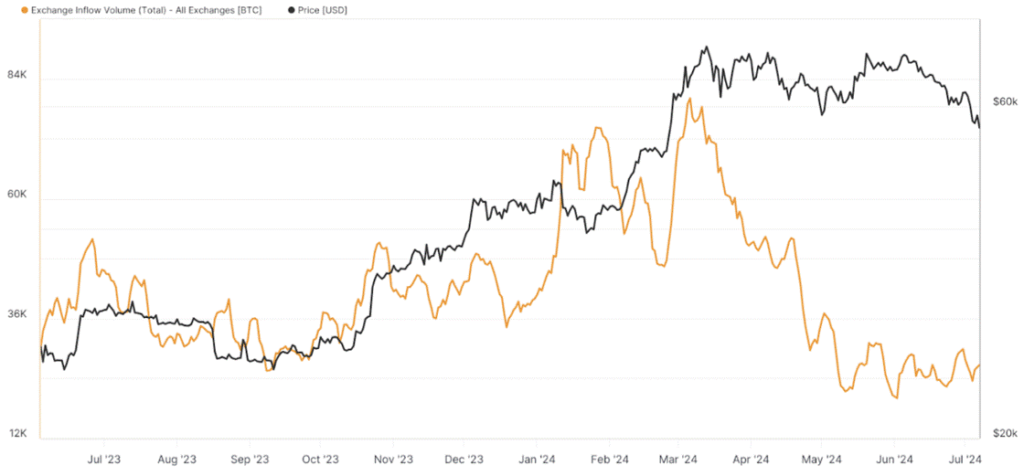
Source: Glassnode
Another factor to consider is miners’ selling pressure. After disposing of nearly 30K BTC in June, miners have finally reduced their selling activity in the past two weeks. This marks their current reserves at around 1.9M BTC, seen below in Figure 3, the lowest point in the last 10 years. Finally, Bitcoin’s mining difficulty is set to decrease by 5%, marking the second largest drop since the FTX collapse. This reduction will benefit miners by enabling them to produce more Bitcoin with less effort, likely improving their profitability.
Figure 3: Bitcoin Miners Balance
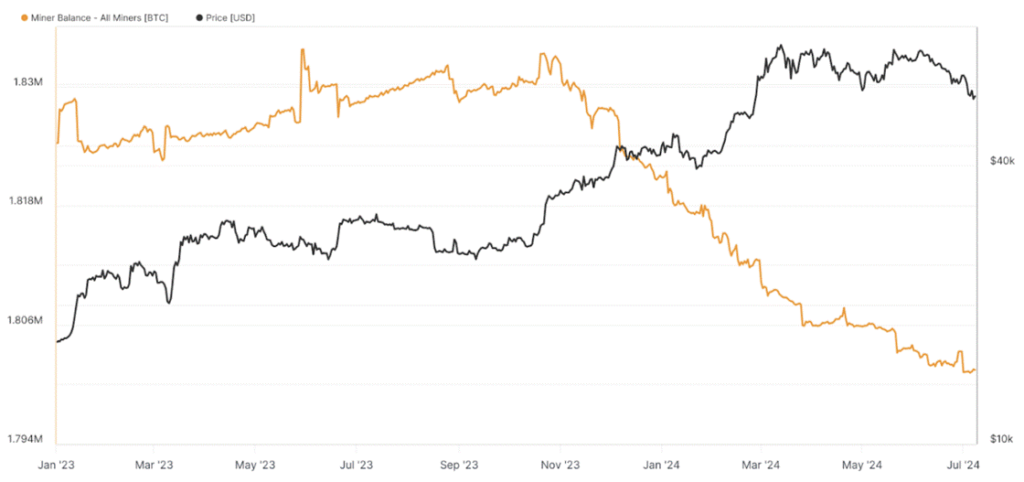
Source: Glassnode
On another positive note, on-chain data shows that Long-term holders (LTHs) have stopped reducing their BTC supply since late June. This is a positive development, as LTHs maintaining a stable supply is crucial for Bitcoin to sustain its upward momentum. Similarly, Bitcoin’s MVRV ratio, which compares its current market price to its ”realized price” (the average price at which each coin was last moved), suggests that Bitcoin is currently trading at levels similar to June 2021 when it was around $30K. Notably, Bitcoin rebounded from the $30K price level to reach its all-time high later in 2021. This could be an encouraging sign of Bitcoin’s growth potential in terms of relative valuation during the current market cycle.
Figure 4: Bitcoin’s Market Value to Realized Value (MVRV)
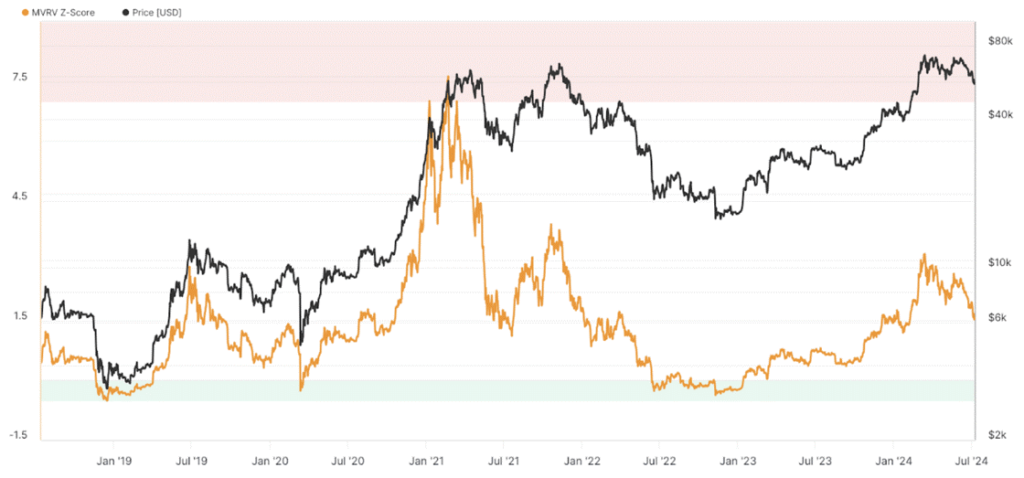
Source: Glassnode
Altogether, there are potential catalysts that could turn the tide in the coming months. For instance, a resurgence in ETF inflows could offset the selling pressure precipitated by the influx of BTC entering the market. Notably, there were days in Q1 when the regulated vehicle absorbed more than 10K BTC, as depicted below in Figure 5. Further, the arrival of new market participants, such as registered investment advisors (RIAs) representing the wealthiest investors, could significantly alter the market’s supply and demand dynamics. In addition, the approval of Ethereum ETFs expected anytime within the next two weeks could also reignite interest in the market. Even if inflows are anticipated to be at best 25% of the $10B invested in Bitcoin’s ETFs in the first few months of the year. It’ll nevertheless catalyze broader interest in the market and can be expected to benefit tokens of the Ethereum ecosystem. Finally, election season is another catalyst for crypto. Particularly in the U.S., Bitcoin has become a polarizing campaigning tool for the Republicans as Trump led the way in advocating for the largest crypto asset by market cap. In fact, the Republican party has officially included the advocacy for BTC as part of their 2024 election campaign, which shows the growing influence of crypto within US politics.
Figure 5: US Spot ETF Inflows Denominated in BTC
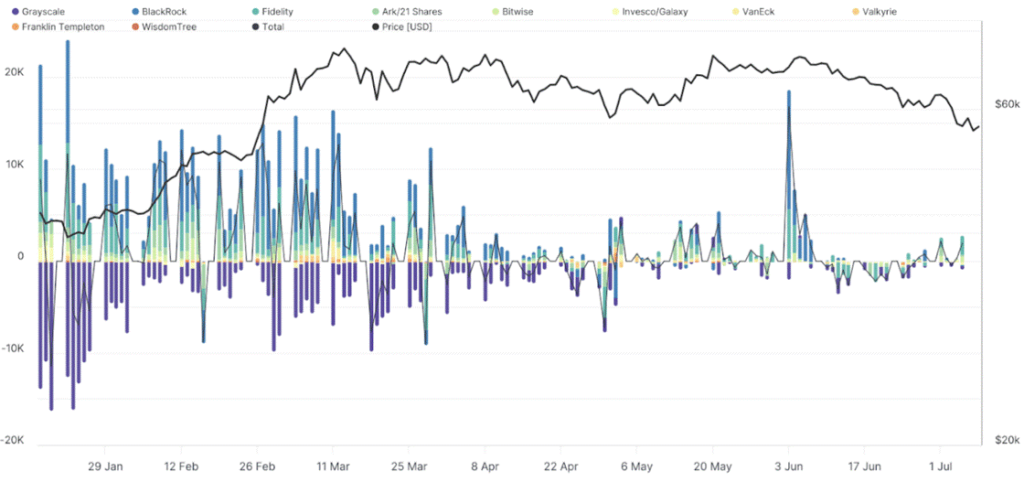
Source: Glassnode
This Week’s Calendar
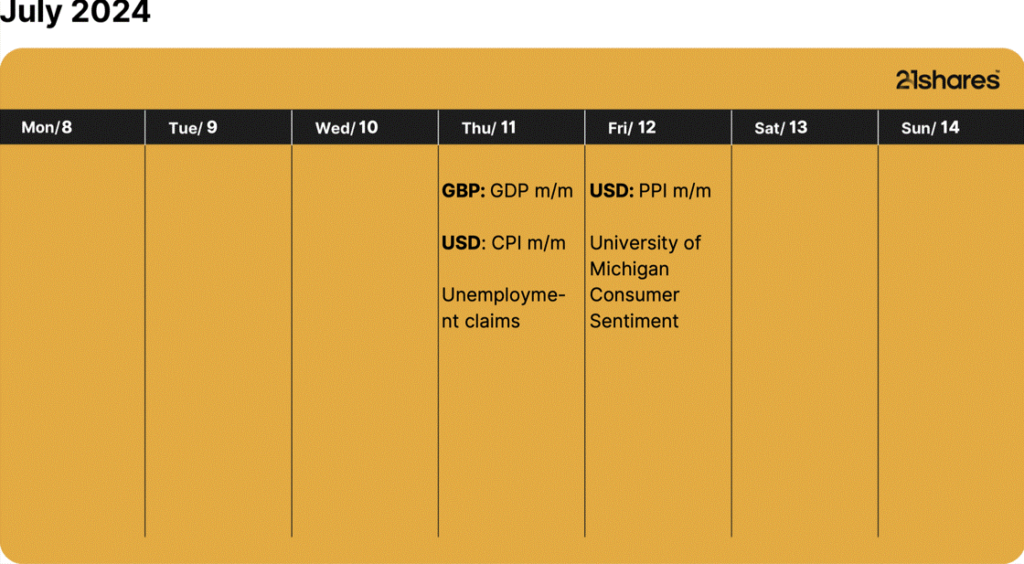
Source: Forex Factory, 21Shares
Research Newsletter
Each week the 21Shares Research team will publish our data-driven insights into the crypto asset world through this newsletter. Please direct any comments, questions, and words of feedback to research@21shares.com
Disclaimer
The information provided does not constitute a prospectus or other offering material and does not contain or constitute an offer to sell or a solicitation of any offer to buy securities in any jurisdiction. Some of the information published herein may contain forward-looking statements. Readers are cautioned that any such forward-looking statements are not guarantees of future performance and involve risks and uncertainties and that actual results may differ materially from those in the forward-looking statements as a result of various factors. The information contained herein may not be considered as economic, legal, tax or other advice and users are cautioned to base investment decisions or other decisions solely on the content hereof.


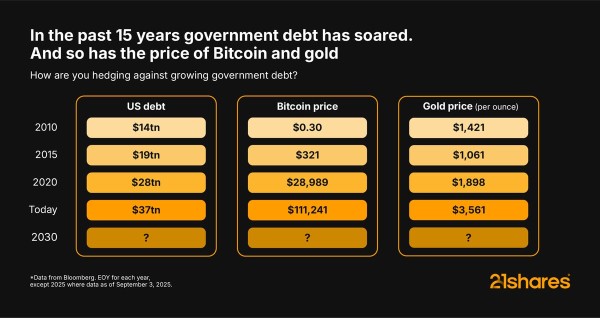
Amid soaring US debt and Gold’s steady gains, Bitcoin has continued to deliver strong returns over the past 15 years. Its scarcity and decentralization make it a hedge that investors can’t ignore, providing new ways to pursue growth, security, and opportunity in an evolving financial landscape.

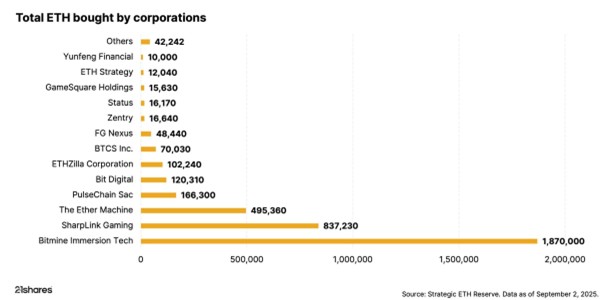
Investors can’t ignore the corporate world’s big bet on Ethereum
Ethereum is stealing the spotlight, as public companies have accumulated over 4.4 million ETH, worth nearly $19 billion, in the past few months. This treasury boom is outpacing Bitcoin’s early adoption and redefining how Wall Street approaches digital assets.


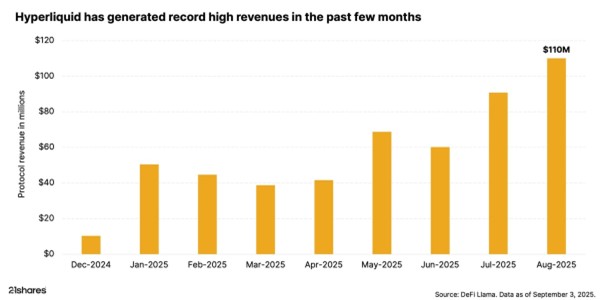
The rise of Hyperliquid: DeFi’s record-breaking powerhouse
Hyperliquid is making waves in DeFi perpetuals by setting new records, leading trading volumes, and propelling its token to all-time highs. Backed by market volatility, high-performance infrastructure, and concentrated liquidity, the platform continues to draw investors and assert its market dominance.

Research Newsletter
Each week the 21Shares Research team will publish our data-driven insights into the crypto asset world through this newsletter. Please direct any comments, questions, and words of feedback to research@21shares.com
Disclaimer
The information provided does not constitute a prospectus or other offering material and does not contain or constitute an offer to sell or a solicitation of any offer to buy securities in any jurisdiction. Some of the information published herein may contain forward-looking statements. Readers are cautioned that any such forward-looking statements are not guarantees of future performance and involve risks and uncertainties and that actual results may differ materially from those in the forward-looking statements as a result of various factors. The information contained herein may not be considered as economic, legal, tax or other advice and users are cautioned to base investment decisions or other decisions solely on the content hereof.


IncomeShares passed three milestones in August. Assets under management climbed to almost $66 million, cumulative fund flows topped $72 million, and turnover across London and Xetra listings reached over $27 million. Palantir paid the highest annualised distribution yield at 57.11%. The sections below break the numbers down in more detail.
Cumulative fund flows
Fund flows track how much money investors put into or take out of IncomeShares ETPs (exchange-traded products). Positive flows mean more money coming in than going out – a sign of demand for the products.
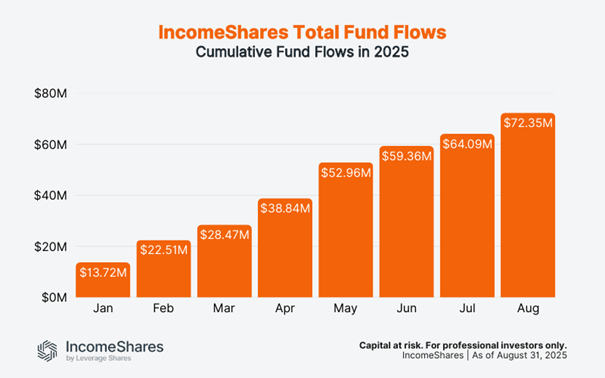
Flows have risen every month this year. In January, they stood at $13.7 million. By the end of August, they reached $72.4 million. That’s over $8 million of new money added in August alone – the biggest increase since May.
Trading turnover
Turnover is the total dollar value of IncomeShares ETPs bought and sold on the exchanges. Higher turnover means more activity and liquidity for investors.
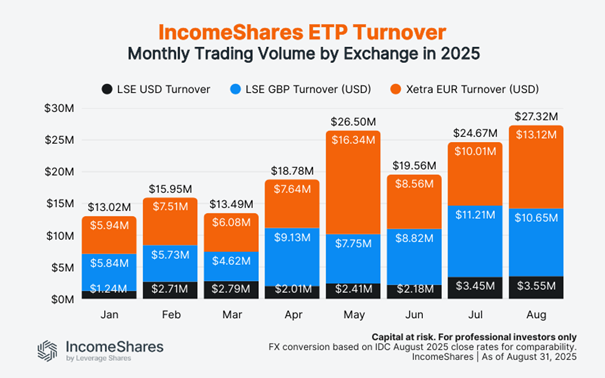
Turnover reached $27.3 million in August – the highest on record and more than double January’s $13.0 million. London listings (USD and GBP combined) made up $14.2 million, with Xetra listings close behind at $13.1 million. Both exchanges have seen steady increases through 2025, showing rising interest in income options strategies across the board.
Note: Figures use IDC FX rates as of the August month-end to convert GBP and EUR into USD. We apply the same August rates to all prior months to compare turnover on a like-for-like basis.
Assets under management (AUM)
AUM is the total value of assets held across all IncomeShares ETPs. It grows when new investors buy in, or when the underlying assets rise in value.
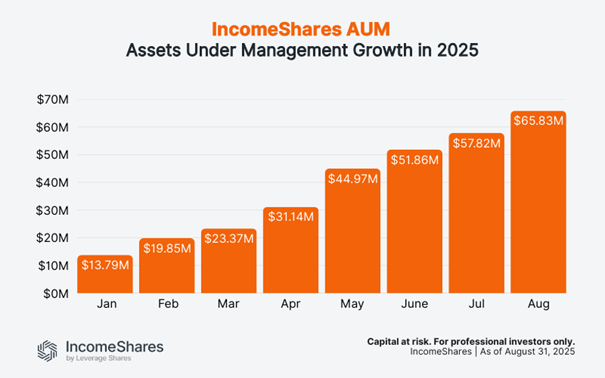
AUM grew from $13.8 million in January to $65.8 million at the end of August. It was also $8 million more than in July. Steady inflows and consistent income distributions are helping the product range build scale.
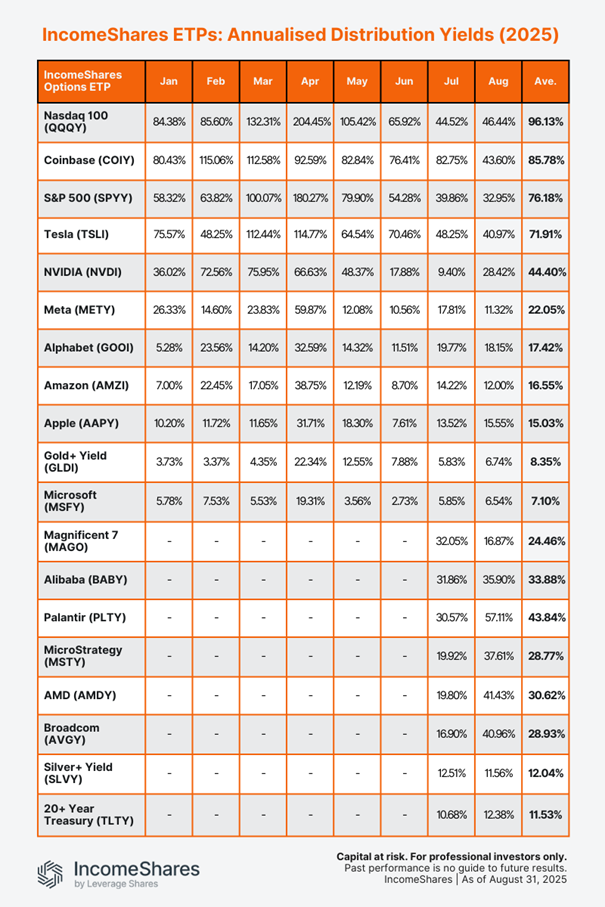
Distribution yields
Distribution yields represent the annualised income paid to investors as a percentage of the current NAV (net asset value), based on the latest month’s yield. IncomeShares ETPs aim to generate this income from selling options. Yields change each month depending on strategy performance and market volatility.
Annualised August yields (ranked highest to lowest):
• Palantir Options ETP (PLTY): 57.11%
• Nasdaq 100 Options ETP (QQQY): 46.44%
• Coinbase Options ETP (COIY): 43.60%
• AMD Options ETP (AMDY): 41.43%
• Tesla Options ETP (TSLI): 40.97%
• Broadcom Options ETP (AVGY): 40.96%
• MicroStrategy Options ETP (MSTY): 37.61%
• Alibaba Options ETP (BABY): 35.90%
• S&P 500 Options ETP (SPYY): 32.95%
• NVIDIA Options ETP (NVDI): 28.42%
• Alphabet Options ETP (GOOI): 18.15%
• Magnificent 7 Options ETP (MAGO): 16.87%
• Apple Options ETP (AAPPY): 15.55%
• 20+ Year Treasury Options ETP (TLTY): 12.38%
• Amazon Options ETP (AMZI): 12.00%
• Silver+ Yield Options ETP (SLVY): 11.56%
• Meta Options ETP (METY): 11.32%
• Gold+ Yield Options ETP (GLDI): 6.74%
• Microsoft Options ETP (MSFY): 6.54%
Our Palantir ETP topped the list with an annualised yield of 57.11% for August, up from 30.57% in July. The stock was volatile in August, trading between $142 and $190. That wider range increased option premiums, which boosted the ETP’s yield. The ETP sells put options on Palantir stock and holds shares – the strategy used for all our single stock ETPs and the Magnificent 7 product.
The Nasdaq 100 ETP paid an annualised yield of 46.44% in August, up slightly from 44.52% in July. At the other end, Gold+ and Microsoft stayed below 7%, reflecting relatively calmer conditions in their underlying assets.
The table below shows the annalised distribution yields for all IncomeShares ETPs so far this year. Note that the bottom eight ETPs launched in late June, so they only have yields for July and August.
Key takeaways
• Fund flows climbed to $72.4 million, with August adding more than $8 million.
• Turnover hit a record $27.3 million, split almost evenly between London and Xetra.
• Palantir topped the yield table at 57%, with Nasdaq 100 and Coinbase also paying above 40%.

Concerned about rising government debt? Bitcoin’s got you covered

N100 ETF följer det amerikanska Nasdaq 100 indexet

IncomeShares Monthly Investor Update – August 2025

CHSJ ETF investerar i CLO-obligationer

HYPE ETP ger exponering mot Hyperliquid

VALOUR ARB SEK spårar priset på kryptovalutan Arbitrum

Månadsutdelande ETFer uppdaterad med IncomeShares produkter

Utdelningar och försvarsfonder lockade i augusti

HANetfs analyserar hur ett fredsavtal kan påverka det europeiska försvaret

De bästa innovations-ETFerna
-
 Nyheter4 veckor sedan
VALOUR ARB SEK spårar priset på kryptovalutan Arbitrum
-
 Nyheter2 veckor sedan
Månadsutdelande ETFer uppdaterad med IncomeShares produkter
-
 Nyheter1 vecka sedan
Utdelningar och försvarsfonder lockade i augusti
-
 Nyheter2 veckor sedan
HANetfs analyserar hur ett fredsavtal kan påverka det europeiska försvaret
-
 Nyheter4 veckor sedan
De bästa innovations-ETFerna
-

 Nyheter3 veckor sedan
HANetfs VD kommenterar Trump-Putin-toppmötet
-

 Nyheter2 veckor sedan
ADLT ETF investerar bara i riktigt långa amerikanska statsobligationer
-

 Nyheter4 veckor sedan
IncomeShares når 60 miljoner dollar i förvaltat kapital – Tillväxtöversikt 2025