
Nyheter
Is Quantum Computing Approaching a Tipping Point?
Wave after wave of transformative technologies have marked the past 100 years — each moving from invention to mass adoption, reshaping society and generating significant economic value along the way. Now, in the 21st century, we may be approaching the next major technological breakthrough: the advent of the quantum computing era.
From the rise of television in the mid-20th century to the smartphone revolution of the early 2000s and, most recently, the breakthrough of generative artificial intelligence, new technologies have defined generations. Take the internet, for example: in the late 1960s, a group of U.S. government researchers began linking computers, inventing a new way to share information. Over the following decades, scientists built upon that foundation. Then, in the 1990s, the World Wide Web emerged — opening the internet to the public and creating the digital backbone for email, ecommerce and social media.
Much like the internet in the 1980s, quantum computing’s evolution is accelerating — it looks closer to a ‘tipping point’ that could release its immense potential. While the technology’s theoretical foundations were established in the late 20th century, only in recent years has this set a wave of innovation in motion. As the wave gathers pace, it has the potential to disrupt industries like finance, medicine and cybersecurity. Even so, it’s important to acknowledge that — despite early use cases — commercial success is not yet assured, and broad adoption may still face challenges.
The Rise of Quantum Computing
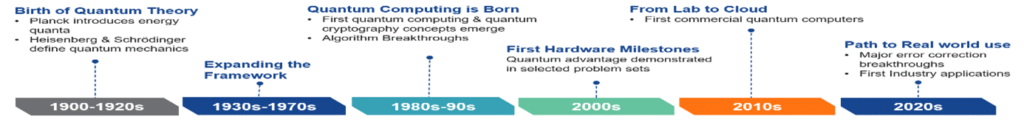
Source: VanEck Research.
Building Momentum: Quantum Investment and Innovation
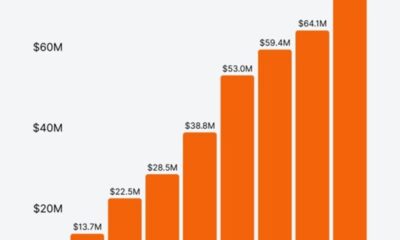
The growing commitment from governments and leading tech companies signals that quantum computing may be approaching a tipping point. According to McKinsey & Company, public investments now exceed $42 billion, underscoring national interest in this transformative technology.1 At the same time, the private sector is rapidly advancing, with over 10,000 quantum-related patents granted in the past five years.2
Global Public Quantum Technology Investments
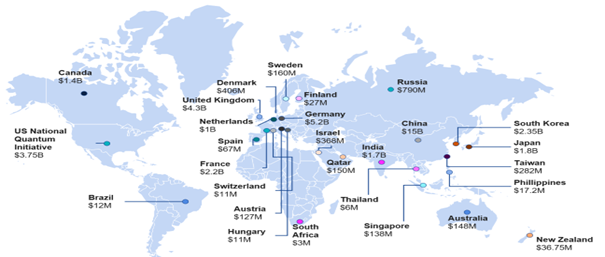
Source: McKinsey & Company (2024). Quantum Technology Monitor.
Economic opportunities are already being explored in various industries. For instance, in finance, quantum computing could be used for optimizing investment portfolios, risk analysis and fraud detection, while also posing a long-term challenge to existing encryption standards. In healthcare, it has promise for drug discovery, molecule simulation and medical data analysis. A notable example is IBM’s collaboration with the U.S. Cleveland Clinic, where the first quantum computer dedicated to healthcare was installed in 2023. Among other applications, it is used to enhance machine learning models for prescribing antibiotics, drawing on a dataset of 4.7 million cases in a 2025 publish case study.3
More recently, D-Wave Quantum Inc, a Californian quantum computing company, made headlines by claiming quantum supremacy on a “useful, real-world problem” through a quantum-optimized simulation of magnetic materials. The achievement—peer-reviewed and published in the journal Science—has sparked widespread discussion across the scientific and tech communities. It could mark a significant step forward in applying quantum computing to materials science.4
The Current State of Quantum Computing
Putting things into perspective, quantum computing is shifting from theoretical research into early-stage commercial exploration — marked by rapid progress, but also significant technical challenges.
As part of this transition, several companies are now offering quantum computers—either through physical purchase and delivery, or via remote access through cloud platforms. Pricing ranges from free public access to enterprise-level subscription models.5 In the past six months, major players have announced notable hardware milestones: Google introduced its Willow chip, Microsoft unveiled its Majorana processor, and Amazon announced Ocelot, which uses cat qubits to improve error correction.
While these developments are promising, they primarily reflect advancements in hardware rather than immediate commercial utility. Most current systems still operate within the so-called NISQ (Noisy Intermediate-Scale Quantum) era — capable of impressive demonstrations but limited by error rates and a lack of scalability. They remain largely experimental and not yet viable for broad, real-world applications.
As a result, much of the current enthusiasm is rooted in long-term potential rather than proven performance. The gap between laboratory breakthroughs and widespread deployment remains wide — and closing it will require sustained innovation and focused execution. Leading firms have acknowledged these challenges and laid out clear roadmaps to address them. Most recently, IBM updated its quantum roadmap, aiming to deliver a fault-tolerant quantum computer by 2029.6
From Potential to Progress
Quantum computing may be approaching a tipping point, with the potential to drive significant innovation. Being an emerging technology, its progress is likely to be uneven, and widespread adoption is far from guaranteed.
Investors who recognize its long-term potential may find it worthwhile to watch the development closely. The next breakthrough could be nearer than we think — and for those who are prepared, it may offer a chance to engage with one of the most promising frontiers in modern technology.
To receive more insights, sign up to our email Newsletter.
1 McKinsey & Co 2024 Technology Monitor.
2 EconSight AG, data as of March 31st 2025, for 2020-2024.
3 Cleveland Clinic, Machine Learning and Quantum Computing Predict Which Antibiotic To Prescribe for UTIs, 2025.
4 D-Wave, Beyond Classical: D-Wave First to Demonstrate Quantum Supremacy on Useful, Real-World Problem, 2025.
5 Examples: https://www.rigetti.com/novera, https://www.ibm.com/quantum/pricing. Accessed May 2025.
6 Example: https://www.ibm.com/roadmaps/quantum/.
IMPORTANT INFORMATION
This information originates from VanEck (Europe) GmbH, Kreuznacher Str. 30, 60486 Frankfurt, Germany, and has been appointed as distributor of VanEck products in Europe by the UCITS Management Company, VanEck Asset Management B.V. The Management Company is incorporated under Dutch law and registered with the Dutch Authority for the Financial Markets (AFM).
For investors in Switzerland: VanEck Switzerland AG, with registered office in Genferstrasse 21, 8002 Zurich, Switzerland, has been appointed as distributor of VanEck´s products in Switzerland by the Management Company. A copy of the latest prospectus, the Articles, the Key Information Document, the annual report and semi-annual report can be found on our website www.vaneck.com or can be obtained free of charge from the representative in Switzerland: Zeidler Regulatory Services (Switzerland) AG, Neustadtgasse 1a, 8400 Winterthur, Switzerland. Swiss paying agent: Helvetische Bank AG, Seefeldstrasse 215, CH-8008 Zürich.
For investors in the UK: This is a marketing communication targeted to FCA regulated financial intermediaries. Retail clients should not rely on any of the information provided and should seek assistance from a financial intermediary for all investment guidance and advice. VanEck Securities UK Limited (FRN: 1002854) is an Appointed Representative of Sturgeon Ventures LLP (FRN: 452811), which is authorised and regulated by the Financial Conduct Authority (FCA) in the UK, to distribute VanEck´s products to FCA regulated firms such as financial intermediaries and Wealth Managers.
This material is only intended for general and preliminary information and shall not be construed as investment, legal or tax advice. VanEck (Europe) GmbH and its associated and affiliated companies (together “VanEck”) assume no liability with regards to any investment, divestment or retention decision on the basis of this information. The views and opinions expressed are those of the author(s) but not necessarily those of VanEck. Opinions are current as of the publication date and are subject to change with market conditions. Information provided by third party sources is believed to be reliable and have not been independently verified for accuracy or completeness and cannot be guaranteed.
Investing is subject to risk, including the possible loss of principal. For any unfamiliar technical terms, please refer to ETF Glossary | VanEck.
This document has not been prepared in accordance with legal requirements designed to promote the independence of investment research and is not subject to any prohibition on dealing ahead of the dissemination of investment research.
No part of this material may be reproduced in any form, or referred to in any other publication, without express written permission of VanEck.
© VanEck (Europe) GmbH ©VanEck Switzerland AG © VanEck Securities UK Limited


Gold steadies near $3,300; miners soar on strong earnings, discipline, and rising margins, hinting at a potential re-rating and new potential bull cycle for gold equities.
Monthly gold market and economic insights from Imaru Casanova, Portfolio Manager, featuring her distinctive views on mining and gold’s portfolio benefits.
To receive more Gold Investing insights, sign up to our newsletter.
Key Takeaways:
• Gold range-bound near $3,300/oz, with catalysts like Fed turmoil and global risks boosting safe- haven demand
• Gold miners surged in August on strong earnings and capital discipline
• Signs of a sector re-rating suggest gold equities may be entering a new bull cycle
Policy Whiplash, Golden Calm
Gold continues to be supported by heightened uncertainty and volatility stemming from persistent global geopolitical and trade tensions and mixed economic signals. In August, gold itself became entangled in the trade-tariff chaos when news reports suggested that the U.S. had imposed tariffs on 1-kilogram and 100-ounce bars of gold1. The White House and President Trump later reassured markets that gold will not be subject to tariffs2. TACO, indeed! The gold tariff fiasco exemplifies the confusing policy environment in the U.S., with markets trying to re-interpret and price in rapidly changing (and conflicting) information daily.
Gold Holds the Line
The gold price has been range-bound around the $3,300 per ounce level following its strong rally post “liberation” day in April3. This sideways action does not surprise us. In recent years, after significant moves to new highs, the gold price tends to consolidate around a new, higher base before the next catalyst emerges that drives it to the next level. While there are plenty of potential catalysts at present, the timing is impossible to predict, but anything that threatens the stability of the global financial system could lead to a surge in safe-haven demand for gold.
From Tariff Talk to Rally Walk
We had a taste of what some of those catalysts may look like on August 20, when President Trump called for the resignation of – and days later announced he had fired – U.S. Federal Reserve (“Fed”) Governor Lisa Cook4. This escalation in assaults on the Fed by the current administration raised fears that the Fed could lose its independence, threatening the stability and credibility of the world’s most important central bank. Gold rallied in response, also supported by increased probabilities of a Fed cut in September and a weaker dollar, closing at $3,447.95 per ounce on August 29, a $158.02 (4.80%) gain for the month5.
As of 31 August, gold was up 78% over the past five years (31 August 2020 – 31 August 2025). Investors should keep in mind that past performance is not a reliable indicator of future results, and that investment in gold is subject to risks, including volatility, the risk of investing in natural resources, and the possible loss of principal. Investing is subject to risk, including the possible loss of principal.
Returns on this investment may increase or decrease as a result of USD/EUR currency movements.
Calm Metal, Hot Miners
The NYSE Arca Gold Miners Index (GDMNTR) (“GDM”) was up a whopping 21.73% during the month6, while the mid-tier and small cap index, MVIS Global Junior Gold Miners (MVGDXJTR), was up 23.35%7. The gold price increase led to an amplified gain for the gold equities, as expected, reflecting their leverage to the metal price. However, the substantial outperformance suggests other factors, beyond the gold price, supported gold mining shares in August. We believe a key driver was a very strong Q2 2025 earnings season: companies generally reported financial and operating results that met or exceeded expectations, with many companies reporting record revenues and free cash flow. Most companies maintained their yearly guidance, and many larger players reiterated their commitment to higher shareholder returns via dividend payments and share buybacks. Investors seemed reassured that higher gold prices are indeed translating into higher margins, higher profitability, lower debt and enhanced growth prospects for the industry. And while August was not a bad month for broader equities, helped by mega-cap tech dominance and optimistic rate-cut speculation, the S&P 500® Index’s monthly increase of approximately 2%8 paled in comparison to the gold miners’ advance. Richly valued U.S. equities, concerns that growth of mega-cap stocks may be fading and high concentration in AI/tech stocks may also be driving portfolio diversification and rotation of capital that is benefiting gold stocks.
Miners Find Their Mojo
After almost two decades of persistent de-rating, could gold equities finally be getting their mojo back? Our data seems to suggest that it could be the case. We have been tracking the relationship between gold bullion and gold equities (GDM) since 2001 (see chart below) and have identified six clear (strong) trends, indicating a significant and prolonged de-rating of the gold mining sector since 2007. A de-rating occurs when a trendline shifts to the right and/or downward. De-ratings in the past were the result of companies consistently disappointing investors. Examples include massively out- of-the-money hedge books in the 2000’s; over indebtedness and low returns on capital in the 2010’s; and missing production and cost targets in the early 2020’s. Now investors are seeing expanding margins, low debt, capital-allocation discipline, and companies doing what they said they would do this year. While it is too early to tell if a new valuation trend is forming, August data is encouraging and may signal the beginning of a new bull cycle for gold mining stocks. For reference, the bull- market trend of 2001-2007 would imply a GDM value of approximately 6,000 at today’s spot gold price, compared to its present value of around 1,800. A return of those historical sector multiples may seem unrealistic and it’s not part of our outlook, but a significant re-rating of the sector is in the cards, in our view. Investors must keep in mind that past performance is not indicative of future results.
As mentioned above, the chart below maps gold prices against the GDM since 2001, highlighting the six trends—and a potential re-rating with a steeper “new trend” emerging since mid-August 2025.
Gold vs NYSE Arca Gold Miners Index
2001 – 2025 Weekly Close
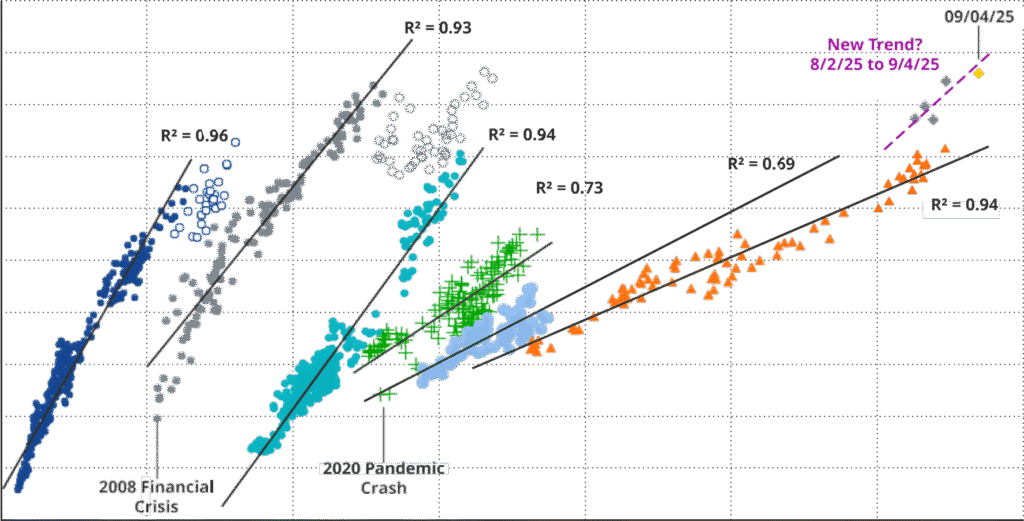
Data as of September 4, 2025. Past performance is no guarantee of future results.
To receive more Gold Investing insights, sign up to our newsletter.
Imaru Casanova
Portfolio Manager,
Gold and Precious Metal
1 Reuters. (07.08.2025)
2 Reuters. (11.08.2025)
3 World Gold Council. (31.08.2025)
4 Reuters, Yahoo Finance. (20.08.2025)
5 World Gold Council. (31.08.2025)
6 FT. (30.08.2025)
7 MarketVector. (31.08.2025)
8 FT. (30.08.2025)
IMPORTANT INFORMATION
This is marketing communication. Please refer to the prospectus of the UCITS and to the KID/KIID before making any final investment decisions. These documents are available in English and the KIDs/KIIDs in local languages and can be obtained free of charge at www.vaneck.com, from VanEck Asset Management B.V. (the “Management Company”) or, where applicable, from the relevant appointed facility agent for your country.


Börshandlade fonder för europeiska small caps

XMGA ETF spårar amerikanska aktier men exkluderar de största företagen

Miners Find Their Mojo as Gold Consolidates

TLTY ETP köper långa statsobligationer och ger utdelning varje månad

EXUS ETF – Levler MSCI World ex USA by Xtrackers

Utdelningar och försvarsfonder lockade i augusti

Septembers utdelning i XACT Norden Högutdelande

HANetf kommenterar mötet mellan Kina, Ryssland och Nordkorea vid militärparad

HANetf kommenterar Norges avtal om krigsfartyg med Storbritannien

JGVE ETF köper statsobligationer som hedgas i Euro
-
 Nyheter4 veckor sedan
Utdelningar och försvarsfonder lockade i augusti
-
 Nyheter3 veckor sedan
Septembers utdelning i XACT Norden Högutdelande
-
 Nyheter4 veckor sedan
HANetf kommenterar mötet mellan Kina, Ryssland och Nordkorea vid militärparad
-
 Nyheter4 veckor sedan
HANetf kommenterar Norges avtal om krigsfartyg med Storbritannien
-
 Nyheter4 veckor sedan
JGVE ETF köper statsobligationer som hedgas i Euro
-
 Nyheter3 veckor sedan
IncomeShares fondflöden nådde en ny rekordnivå i augusti
-

 Nyheter4 veckor sedan
USBG ETF köper statsobligationer och hedgar dem i dollar
-
 Nyheter4 veckor sedan
September är extremt