
Nyheter
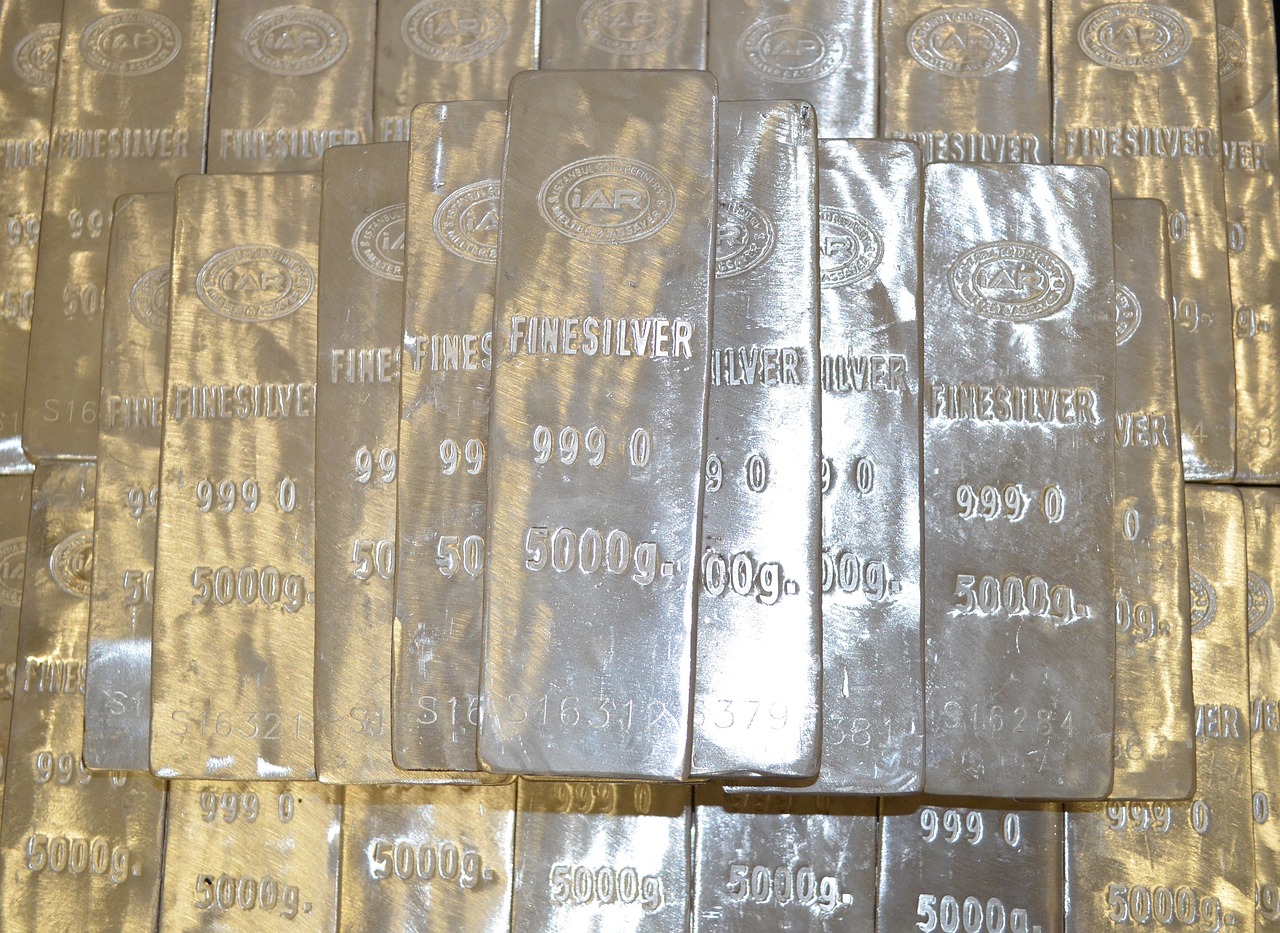
Gold’s Long-Term Appeal Remains Intact
Market Review – Gold’s Long-Term Appeal Remains Intact
Gold Market Commentary December 2016
Consolidation in Gold Market on U.S. Dollar Strength
It looks as if gold is now consolidating the losses experienced since the November U.S. presidential election. Gold reached its lows for the month of December at $1,137 per ounce following the Federal Reserve’s (the “Fed”) December 14 announcement to increase the targeted federal funds rate1 by 25 basis points. The Fed’s decision also caused the U.S. Dollar Index (DXY)2 to jump to new highs. Gold finished the month at $1,152.27 per ounce, down $20.98 (1.8%). Net redemptions in the gold bullion exchange traded products (ETPs) continued their post-presidential election slide, although the pace tapered at yearend. Since the Trump victory, there have been net outflows of 7.2 million ounces in global bullion ETPs, bringing net inflows for the year to a still impressive 11.8 million ounces.
Gold stocks were also in consolidation mode, as the NYSE Arca Gold Miners Index (GDMNTR)3 gained 1.1% and the MVIS Junior Gold Miners Index (MVGDXJTR)4 fell 2.0%.
Although Ignored, Markets Events Could Add Long-Term Support
There were two unrelated developments in December that the markets largely ignored which we believe could have positive implications for gold in the longer term. On December 4, Italian voters rejected a constitutional referendum that effectively became a vote of no-confidence for Prime Minister Matteo Renzi, who promptly resigned. This is the latest in a string of populist victories around the globe driven by voters frustrated with established political parties that have been unable to bring policies that generate needed jobs. Instead, post-crisis policies have brought an unprecedented coordination of regulations, monetary experiments, austerity, and debt expansion. The outcome of the referendum has empowered opposition parties in Italy who question whether the country should remain in the European Union (EU). The implementation of Brexit in 2017 poses significant risks to the European economy and the Italian referendum is further evidence of a broader movement that undermines the EU. Important elections will be held in the Netherlands (March 2017), France (April 2017), and Germany (August – October 2017). Gold could benefit if risks of an EU breakup increase.
On December 5, a second potentially favorable development for gold occurred when the Shari’ah Standard on Gold (the “Standard”) was released by the Accounting and Auditing Organization for Islamic Financial Institutions (AAOIFI).5 The Standard, for the first time, sets out specific rules for the use of gold as an investment in the Islamic finance industry.
Until now, there have been no such rules which has led to confusion over whether or not Islamic households are permitted to invest in gold. Those who wanted to own gold were compelled to invest only in jewelry. The Standard also rules that it is permissible to invest in gold mining stocks. This opens a significant segment of the global population that already has an affinity for gold to initiate potential investments in gold bars, coins, ETPs, and stocks.
2016 Should Be Remembered as Strong Year and Turning Point for Gold
While the post-election performance of gold and gold stocks has been disappointing, 2016 overall remained a strong year and a major turning point for gold investments. Gold gained $91 per ounce or 8.6% in 2016 for its first annual gain in four years. But gold stocks stole the show, with gains of 54.4% for GDMNTR and 75.1% for MVGDXJTR.
There are several reasons for the spectacular performance of gold stocks including:
- A rebound from 2015 bear market levels that were very oversold as the industry fell out of favor with investors who had been avoiding the sector, driving valuations to record lows
- Gold companies impressed investors with their cost controls, operating results, and overall financial discipline
- Earnings leverage to the gold price
Strong performance like what was experienced in 2016 is common at major turning points in the gold market. For example, the GDMNTR gained 80% in 2002 and in 2009 the Index rose 37%.
Be Wary of Consensus Opinion and Short-Term Overreaction
If 2016 taught us anything, it is that whatever the consensus says is going to happen in economics, investments, or politics in the coming year will probably be wrong. This year the Fed is again showing optimism towards the U.S. economy, guiding for three rate increases in 2017. The market responded in December by selling gold and driving the U.S. dollar higher. The Fed, however, has had a dismal forecasting record and we see no reason to believe that 2017 will be any different. At this time last year the Fed was guiding for four rate increases in 2016, yet there was only one.
The Trump honeymoon with the stock market is in full bloom, as the financial media prepares to celebrate should the Dow Jones Industrial Average (DJIA)6 cross 20,000 points. The stock market is reflecting a consensus for robust economic growth, and the Trump administration certainly has the potential to implement policies that promote growth. However, it seems the market is ignoring many potential risks the new administration may face. These include attempting to change trade treaties, immigration policies, Democrats and deficit hawks in Congress, the national debt, and Fed tightening. Potential moves by China or Russia, disarray in the EU, and strife the Middle East could also impact the administration’s efforts. We believe many of these risks will surface in 2017, reversing the positive sentiment in the stock market and U.S. dollar to gold’s benefit.
Forming the Base of a Long-Term Bull Market
Through most of 2016 we had been very bullish on gold, believing it had embarked on a new bull market. This belief was based on fundamentals, which included unprecedented levels of peacetime sovereign debt and monetary policies, such as quantitative easing7 and negative rates, which distort markets and pose systemic risks. While we were premature in forecasting a new gold bull market, we continue to believe these risks will ultimately drive gold to new highs. However, the turn the markets took following the U.S. presidential election took us entirely by surprise. The positive sentiment towards gold proved to be fickle and it appears the market will need more substantial evidence that the risks we see coming are in fact imminent.
We now characterize 2016 and 2017 as a base-forming phase for gold, probably a precursor to a bull market. The bear market trend from 2011 to 2015 has clearly been broken and 2016 showed us that investors are becoming quite skittish of systemic financial risks.
The following chart shows where gold might be in the context of similar markets of the past. Gold has a strong negative correlation8 with the dollar. This is shown by the peaks and troughs on the gold chart roughly correlating with the troughs and peaks respectively on the U.S. dollar chart. The U.S. dollar has been in a bull market since 2011 that is now similar in magnitude to bull markets of the early eighties and late nineties. These all correspond to bear markets for gold. As the dollar approached its peaks in 1985 and 2001, gold formed a double-bottom before embarking on new bull markets. In 1985, gold began a cyclical bull phase within a longer-term secular bear market. In 2001, gold began a historic secular bull market. It now looks like December 2015 was the first low for gold in this cycle. What remains unclear is whether the second low in a double-bottom was set in December 2016 or whether there is further weakness to come. In any case, it looks like gold is forming a base and historical analysis suggests that downside is limited.

(click to enlarge)
1In the U.S., the federal funds rate is “the interest rate” at which depository institutions actively trade balances held at the Federal Reserve, called federal funds, with each other, usually overnight, on an uncollateralized basis. Institutions with surplus balances in their accounts lend those balances to institutions in need of larger balances.
2U.S. Dollar Index (DXY) indicates the general international value of the U.S. dollar. The DXY does this by averaging the exchange rates between the U.S. dollar and six major world currencies: Euro, Japanese yen, Pound sterling, Canadian dollar, Swedish kroner, and Swiss franc.
3NYSE Arca Gold Miners Index (GDMNTR) is a modified market capitalization-weighted index comprised of publicly traded companies involved primarily in the mining for gold.
4MVIS Global Junior Gold Miners Index (MVGDXJTR) is a rules-based, modified market capitalization-weighted, float-adjusted index comprised of a global universe of publicly traded small- and medium-capitalization companies that generate at least 50% of their revenues from gold and/or silver mining, hold real property that has the potential to produce at least 50% of the company’s revenue from gold or silver mining when developed, or primarily invest in gold or silver.
5The Accounting and Auditing Organisation for Islamic Financial Institutions (AAOIFI) is the recognized world leader in Islamic finance standards, and its rulings are widely accepted across the majority of Islamic markets.
6The Dow Jones Industrial Average (DJIA) is a price-weighted average of 30 significant stocks traded on the New York Stock Exchange (NYSE) and the NASDAQ.
7Quantitative easing (QE) is an unconventional monetary policy used by a central bank to stimulate an economy when standard monetary policy has become ineffective.
8The correlation coefficient is a measure that determines the degree to which two variables’ movements are associated and will vary from -1.0 to 1.0. -1.0 indicates perfect negative correlation, and 1.0 indicates perfect positive correlation.

by Joe Foster, Portfolio Manager and Strategist
With more than 30 years of gold industry experience, Foster began his gold career as a boots on the ground geologist, evaluating mining exploration and development projects. Foster is Portfolio Manager and Strategist for the Gold and Precious Metals strategy.
1In the U.S., the federal funds rate is “the interest rate” at which depository institutions actively trade balances held at the Federal Reserve, called federal funds, with each other, usually overnight, on an uncollateralized basis. Institutions with surplus balances in their accounts lend those balances to institutions in need of larger balances. 2The correlation coefficient is a measure that determines the degree to which two variables’ movements are associated and will vary from -1.0 to 1.0. -1.0 indicates perfect negative correlation, and 1.0 indicates perfect positive correlation. 3U.S. Dollar Index (DXY) indicates the general international value of the U.S. dollar. The DXY does this by averaging the exchange rates between the U.S. dollar and six major world currencies: Euro, Japanese yen, Pound sterling, Canadian dollar, Swedish kroner, and Swiss franc. 4The ISM Manufacturing Index is an index based on surveys of more than 300 manufacturing firms by the Institute of Supply Management. The ISM Manufacturing Index monitors employment, production inventories, new orders and supplier deliveries. 5A survey of consumer confidence conducted by the University of Michigan. The Michigan Consumer Sentiment Index (MCSI) uses telephone surveys to gather information on consumer expectations regarding the overall economy. 6The U.S. consumer confidence index (CCI) is an indicator designed to measure consumer confidence, which is defined as the degree of optimism on the state of the economy that consumers are expressing through their activities of savings and spending. 7NYSE Arca Gold Miners Index (GDMNTR) is a modified market capitalization-weighted index comprised of publicly traded companies involved primarily in the mining for gold. 8MVIS Global Junior Gold Miners Index (MVGDXJTR) is a rules-based, modified market capitalization-weighted, float-adjusted index comprised of a global universe of publicly traded small-and medium-capitalization companies that generate at least 50% of their revenues from gold and/or silver mining, hold real property that has the potential to produce at least 50% of the company’s revenue from gold or silver mining when developed, or primarily invest in gold or silver.
Please note that the information herein represents the opinion of the author and these opinions may change at any time and from time to time.


The UK is shaking up crypto. This month, the Financial Conduct Authority (FCA) proposed lifting its ban on crypto exchange-traded notes for retail investors, a positive step in a global race to regulate digital assets and provide consumer protection.


Key metrics show Bitcoin’s rally isn’t over
Bitcoin is above $100K, and key indicators suggest a growing momentum and a potential for further upside. The Bitcoin Fear & Greed Index sits at 62, reflecting a sentiment that remains near neutral. This lack of extreme greed suggests that the rally may still have room to run in the near term.


Apple wants to enter Circle’s orbit. Why are stablecoins the tech world’s new darling?
Stablecoin issuer Circle made a blockbuster debut on the New York Stock Exchange earlier this month. Now, tech giants like Apple, Meta, and Google are reportedly exploring stablecoin integrations, marking another major step toward merging digital assets with mainstream technology.


Research Newsletter
Each week the 21Shares Research team will publish our data-driven insights into the crypto asset world through this newsletter. Please direct any comments, questions, and words of feedback to research@21shares.com
Disclaimer
The information provided does not constitute a prospectus or other offering material and does not contain or constitute an offer to sell or a solicitation of any offer to buy securities in any jurisdiction. Some of the information published herein may contain forward-looking statements. Readers are cautioned that any such forward-looking statements are not guarantees of future performance and involve risks and uncertainties and that actual results may differ materially from those in the forward-looking statements as a result of various factors. The information contained herein may not be considered as economic, legal, tax or other advice and users are cautioned to base investment decisions or other decisions solely on the content hereof.


SGS5 ETP spårar priset på silverterminer

GIGU ETF investerar aktivt i USD-denominerade företagsobligationer
UK looking to lift the retail ban on crypto ETPs

AMEM ETF, de ledande aktierna från tillväxtmarknaderna i en enda transaktion
21Shares noterarar fem nya krypto-ETPer Nasdaq Stockholm

Montrose befäster sin position som den populäraste ETFen

BNP Paribas Asset Management lanserar Europe Defense ETF

Global X noterar Europafokuserad försvarsfond

Kommer Nordea att lansera nya börshandlade fonder?
Nu introduceras fem nya europeiska börser på Nordnet – courtagefri handel under maj
-
 Nyheter3 veckor sedan
Montrose befäster sin position som den populäraste ETFen
-
 Nyheter3 veckor sedan
BNP Paribas Asset Management lanserar Europe Defense ETF
-
 Nyheter4 veckor sedan
Global X noterar Europafokuserad försvarsfond
-
 Nyheter3 veckor sedan
Kommer Nordea att lansera nya börshandlade fonder?
-

 Nyheter4 veckor sedan
Nu introduceras fem nya europeiska börser på Nordnet – courtagefri handel under maj
-

 Nyheter3 veckor sedan
BlackRock lanserar europeisk försvars-ETF för europeiska investerare
-
 Nyheter4 veckor sedan
YieldMax™ tillkännager första utdelningen för YYYY
-

 Nyheter4 veckor sedan
Rivstart för Montrose ETF-satsning!