
Nyheter
Gold Reacts to Dwindling Reflation Trade
Market Review – Gold Reacts to Dwindling Reflation Trade
Weak U.S. Dollar, Economic and Political Stability Support Gold Price Recovery
The gold price changed very little in May, recovering towards the end of the month after early weakness brought on by the French presidential election and the FOMC (Federal Open Market Committee) meeting. From the first round of the French elections on April 23 to the final round on May 7, markets became increasingly convinced that the pro-EU candidate Emmanuel Macron would win the election. This pressured gold as the risk of a Marine Le Pen-led Eurozone break-up lessened. On May 3, comments by the Federal Reserve (Fed) following its May FOMC meeting convinced the market that a rate increase following the June 13 meeting would be likely. Gold hit its low for the month on May 9 at $1,214 per ounce, but was able to regain lost ground to end the month up $0.65 (0.05%) at $1,268.94 per ounce. Weakness in the U.S. dollar also added support for gold during the month. The U.S. Dollar Index (DXY)1 fell 2.1% in May and appears to have entered a bearish downtrend since reaching multi-year highs in early January. Economies in Europe and Japan have stabilized recently and the Trump administration has indicated a desire for a weaker U.S. dollar. Gold should benefit if the U.S. dollar trend seen so far in 2017 continues.
Asian Physical Gold Demand Appears Strong in 2017
Physical gold demand from India and China has also been supportive of gold prices. We believe healthy demand in March and April along with anecdotal comments from analysts suggest that 2017 is shaping up to be a much better year for gold in Asia. Last year’s liquidity squeeze caused by the currency transformation in India seems to have dissipated and people are again making gold purchases. In China, bond market turbulence associated with government efforts to rein in debt and speculation have spurred investment demand for gold.
Juniors and Mid-Tiers Underperform But Not Based on Fundamentals
Chart patterns for the gold equity indices mimicked gold bullion in May. The NYSE Arca Gold Miners Index2 (GDMNTR) gained 1.07%, while the MVIS™ Global Junior Gold Miners Index3 (MVGDXJTR) fell 3.66%. The juniors and some mid-tier gold miners have underperformed the larger producers over the past two months with no significant change in gold bullion prices. We find no fundamental reason for the underperformance, and therefore expect some mean reversion to favor the juniors in the second half of the year.
Is U.S. Equity Market Bubble Set to Burst?
Following the November presidential election the “reflation” or “Trump” trade took the markets by storm. Presumably, the belief was that pro-growth policies would ignite animal spirits in the markets that would stimulate business and prosperity. As President Trump has struggled to implement policies and his administration has been dogged by controversy, the Trump trade has unwound. Metals such as copper and iron-ore have given up much, if not all, of their post-election price gains. Gold has rebounded from its post-election losses. Interest rates have subsided and the DXY has fallen to pre-election levels. The one asset class that appears to still believe in the reflation trade is U.S. equities. As we write, the S&P 500 Index4 has reached new, all-time highs. In the past year, the likes of Apple and Tesla have posted gains of more than 50%. A chart of NYSE margin debt is worth a thousand words.

Notice the peaks at the tops of the tech (2000) and housing bubbles (2007) compared with current levels. Each of these bubbles was accompanied by strong 3% to 4% economic growth and each was preceded by a Fed tightening cycle. While the current stock market does not have the same feeling of mania seen before the tech bust, in the context of an economy that struggles to achieve 2% growth, we struggle to justify current stock market valuations – and the Fed is tightening. At the other end of the spectrum are gold stocks, fresh off of the worst bear market in their history from 2011 to 2015. A chart in our April update showed gold stock valuations below long term averages. Secular market tops and bottoms are notoriously difficult to predict, however, we believe the signs are there to make such a prediction for S&P stocks and gold stocks respectively.
Industry’s Current Growth Strategy Reflected in Portfolio’s Corporate Activity Level
Our gold fund performance received a boost in May when each of our top three junior positions became the targets of corporate activity.
Gold Road Resources (2.3% of net assets*) discovered the multi-million ounce Gruyere deposit in Western Australia in 2013. Currently under development, Gruyere is set to begin producing gold in 2018. On May 19 South Africa-based major Gold Fields (0% of net assets*) announced the purchase of a 10% stake in Gold Road at a 27% premium to the closing share price.
In 2007 Continental Gold (3.0% of net assets*) purchased Buritica, a small scale gold operation in Colombia with production that dates back to 17th century colonial times. Through exploration and drilling, Continental has identified a multi-million ounce, high-grade deposit that is scheduled to become Colombia’s first large-scale underground mining operation in 2020. On May 11 Denver-based major Newmont Mining (4.4% of net assets*) announced the purchase of a 19.9% position in Continental at a 46% premium to the closing share price.
In 2014 Integra Gold (3.0% of net assets*) bought the historic Sigma and Lamaque Mines in Quebec, Canada. From 1935 to 1985 the property produced 4.5 million ounces of gold. In 2015 Integra discovered mineralization in the Triangle deposit that the old timers missed. Triangle now has a resource of 1.8 million ounces and the company was making plans to construct a mine and expand the resource further. On May 14, Vancouver-based mid-tier Eldorado Gold (0.9% of net assets*) announced the friendly takeover of Integra at a 51% premium to the closing share price.
We were early investors in each of these gold development companies and have visited each of their properties. We increased our positions as they added value to their projects. Our conviction grows when a large gold company, with their teams of geologists and engineers, decides one of our portfolio companies is of strategic importance. We can’t remember ever seeing three of our companies receiving such attention in a single month. This is a reflection of the current growth strategy in the sector. In past cycles, large companies have been guilty of overpaying for acquisitions and destroying value. They would wait until a junior advanced a project to the point of construction. Instead, producers are now taking strategic equity stakes at an earlier stage in companies with properties they believe will develop into mines. That way, if they pull the acquisition trigger, they don’t have to pay a premium on the portion they own. Eldorado used this strategy by taking a 15% stake in Integra in 2015 at C$0.28, versus the C$1.21 they are now paying for the portion of Integra they do not own.
Acquisition activity has been subdued in the sector, while strategic positioning has become a frequent occurrence. In some cases, two producers have taken a strategic stake in the same junior developer. Not all gold properties become profitable mines and not all producers will have the same success that Eldorado has had with Integra. Gold production is no longer growing globally and many companies will face declining production in the years to come. To offset this, once the current phase of strategic positioning has run its course, we believe there will be another robust M&A cycle, possibly beginning in 2018.
1 U.S. Dollar Index (DXY) indicates the general international value of the U.S. dollar. The DXY does this by averaging the exchange rates between the U.S. dollar and six major world currencies: Euro, Japanese yen, Pound sterling, Canadian dollar, Swedish kroner, and Swiss franc.
2 NYSE Arca Gold Miners Index (GDMNTR) is a modified market capitalization-weighted index comprised of publicly traded companies involved primarily in the mining for gold.
3 MVIS™ Global Junior Gold Miners Index (MVGDXJTR) is a rules-based, modified market capitalization-weighted, float-adjusted index comprised of a global universe of publicly traded small- and medium-capitalization companies that generate at least 50% of their revenues from gold and/or silver mining, hold real property that has the potential to produce at least 50% of the company’s revenue from gold or silver mining when developed, or primarily invest in gold or silver.
4 S&P 500® Index (S&P 500) consists of 500 widely held common stocks, covering four broad sectors (industrials, utilities, financial and transportation).
by Joe Foster, Portfolio Manager and Strategist
With more than 30 years of gold industry experience, Foster began his gold career as a boots on the ground geologist, evaluating mining exploration and development projects. Foster is Portfolio Manager and Strategist for the Gold and Precious Metals strategy.
Please note that the information herein represents the opinion of the author and these opinions may change at any time and from time to time.
Important Information
This commentary originates from VanEck Associates Corporation (“VanEck”) and does not constitute an offer to sell or solicitation to buy any security.
VanEck’s opinions stated in this commentary may deviate from opinions presented by other VanEck departments or companies. Information and opinions in this commentary are based on VanEck’s analysis. Any forecasts and projections contained in the commentary appear from the named sources. All opinions in this commentary are, regardless of source, given in good faith, and may only be valid as of the stated date of this commentary and are subject to change without notice in subsequent versions of the commentary. Any projections, market outlooks or estimates in this material are forward-looking statements and are based upon certain assumptions that are solely the opinion of VanEck. Any projections, outlooks or assumptions should not be construed to be indicative of the actual events which will occur.


The iShares 20+ Year Treasury Bond ETF (TLT) holds US government bonds that mature in 20 years or more. Since peaking in March 2020 at $179.90 per share, TLT’s price is still down roughly 50%. Most of that drop happened as US inflation – and then interest rates – rose to multi-decade highs. But with inflation now below 3%, potential interest rate cuts ahead, and an interesting chart setup, the investment case for TLT could be building.
What is TLT?
The iShares 20+ Year Treasury Bond ETF (TLT) is an exchange-traded fund (ETF) that trades on the US stock market. The fund holds “long-dated” US government bonds with maturities of 20 years or more. By holding a basket of them, TLT reflects how investors generally value this part of the bond market.
Each bond in TLT is a 20-plus year loan to the US government. The investor lends money, and in return receives fixed interest payments (coupons) each year. The government sets the coupon rate when it issues (creates) a new bond, and that rate never changes. After issuance, the bond can trade on the bond market, where its price may move up or down.
What affects the value of long-dated US Treasury bonds (and TLT)?
All else being equal, long-dated Treasury bonds tend to be more volatile than shorter-dated ones. Interest rates and inflation expectations are the two main levers that can move their prices – and hence the price of TLT.
Interest rates: When rates rise, newly issued bonds pay higher coupons. Older bonds in TLT can then look relatively less attractive, so their prices may fall. When rates fall, it’s the opposite: new bonds pay lower coupons, so older bonds look “better” and may rise in price. Because TLT only holds long-dated bonds, its price tends to react more to interest rate changes than short-term bond funds. Rate shifts tend to have a bigger impact on long-dated bonds because their fixed coupons extend far into the future. Even a small change in yields can make those older coupons look much better – or much worse – for a very long time.
Inflation expectations: When investors expect higher inflation in the future, the fixed coupons (and principal) in TLT can look less valuable in today’s money. That perception can push bond prices down as investors sell bonds. And when investors think future inflation will be lower, the same coupons can look more valuable today, which may support bond prices. Because TLT’s bonds mature further into the future, inflation has more time to erode their interest and principal repayments. That’s why long-dated bonds are usually more sensitive to inflation than shorter-dated ones.
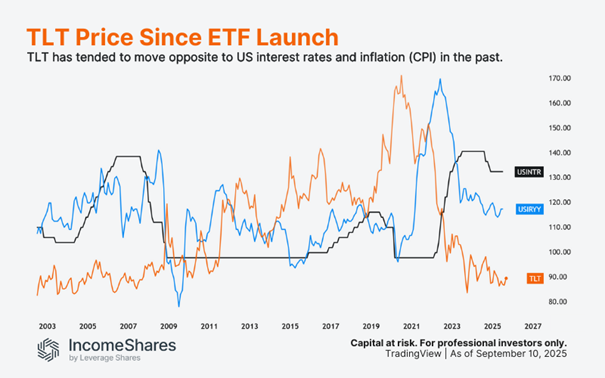
The chart below compares the price of TLT (orange) with US interest rates (black) and US inflation (blue). It’s not an exact science, but TLT has tended to move opposite to both of them since the ETF launched in 2003.
Other factors can also play a role. The US government regularly issues (creates) new bonds, and if supply goes up, prices can fall. On the demand side, big buyers like pension funds, insurance companies, or foreign central banks can move the market. Credit risk perception is also key. Investors usually see Treasuries as very low risk, but not “risk-free”. So if they lose confidence in the US government’s repayment ability, it could hurt bond prices.
The investment case for TLT today
We’ve explained how lower interest rates and lower inflation might be a better environment for long-dated US treasury bonds. As explained below, there are reasons to believe we could be moving into that environment now.
The US Federal Reserve (Fed) essentially has two jobs, and it’s a constant balancing act between the two:
- Keep inflation down (by raising interest rates to slow the economy).
- Keep employment high (by lowering interest rates to speed up the economy).
US inflation peaked above 9% in June 2022, and it’s been trending lower ever since. Inflation isn’t very low yet (2.9% CPI as of August) – but it’s low enough for the Fed to focus more on job number two. Factor in a slowing economy, and the Fed is more likely to cut interest rates from here to boost employment numbers.
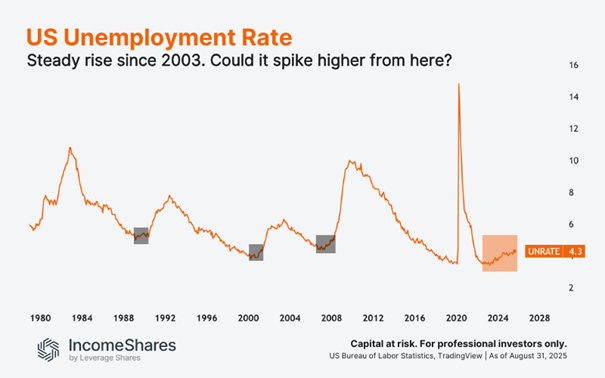
The chart below shows the US unemployment rate in orange. It’s now at 4.3% (August) – the highest unemployment rate since November 2021. In the past, unemployment rose gradually at first, before eventually breaking much higher. If that pattern repeats, we could see a bigger spike in unemployment.
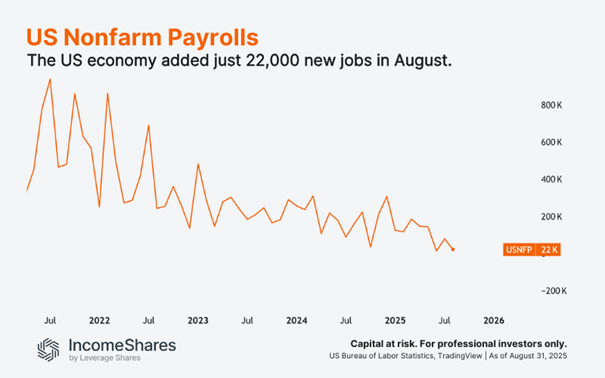
Not only is the unemployment rate rising, but the number of new job openings is dropping, too. US nonfarm payrolls (new jobs excluding farming, private households, non-profits, and the military) showed that the US economy added just 22,000 new jobs in August.
And to make matters worse, the government also revised its earlier estimates down. The adjustment meant the US added around 911,000 fewer jobs in the year through March 2025 than first reported.
AI could also factor into these numbers. After all, companies are rolling out AI tech to improve productivity – and that puts pressure on the “human” job market. AI can also make goods and services cheaper to produce, which is inherently disinflationary (the opposite of inflation).
This setup could give the Fed more ammo for bigger rate cuts in the future. Throw in lower inflation, and we could see a solid backdrop for TLT.
The technical picture for TLT
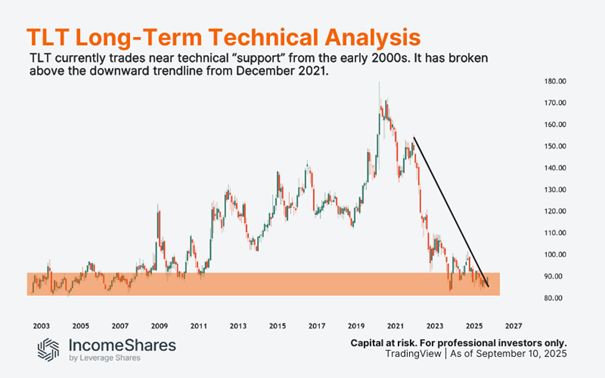
Not many assets are trading near 20-year lows. But as the chart below shows, TLT is trading near technical “support” from the early 2000s (orange). Also note that TLT recently broke above a downward sloping trendline that’s been in play since December 2021. This may signal that selling pressure is easing, and buyers are stepping in.
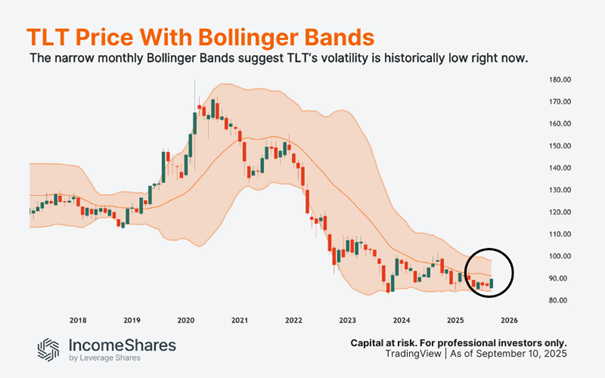
The chart below shows Bollinger Bands around TLT’s price. Here, the middle band is TLT’s 20-month average price, and each red or green candle represents one month of price movement for TLT.
The further the outer bands are from the middle band, the more volatile TLT’s price, according to the indicator. At this point, the Bollinger Bands are pinching together – a sign of relatively low volatility for TLT. Volatility tends to be “mean reverting” – meaning it usually cycles from periods of lower volatility to higher volatility. If the bands now start to widen, and the price trends higher, we could see a sustained rally for TLT.
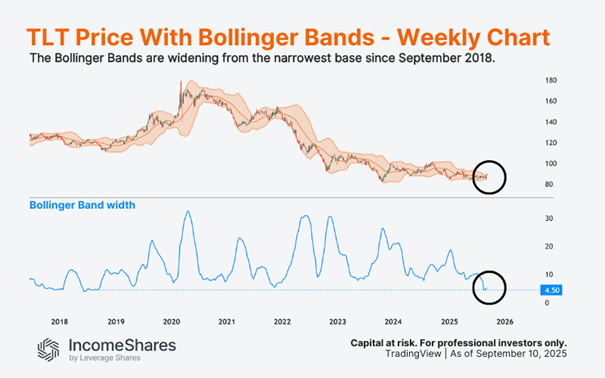
The next chart zooms into the weekly timeframe, where each red or green candle represents one week of price movement for TLT. In this case, the Bollinger band width represents the volatility of TLT around its 20-week moving average. The blue line underneath it shows the width of the Bollinger Bands – lower is narrower, and less volatility.
Last month, the Bollinger Bands reached their narrowest level since September 2018. In other words, TLT’s volatility reached its lowest level in seven years, according to the indicator. Now notice how the bands started expanding this month – from that very low volatility base. This suggests TLT could see more volatility going into the end of 2025. Keep in mind that volatility is direction neutral.
Risks
The investment case for TLT depends heavily on inflation staying low and the Fed being willing to cut rates. If inflation rises again, TLT may fall further. Heavy government borrowing could also pressure Treasuries if investors demand more compensation to buy the debt. And if the economy holds up better than expected, the Fed might not need to cut rates.
How IncomeShares ties in
The IncomeShares 20+ Year Treasury Options ETP holds TLT and sells call options on it.
• Selling calls generates option premiums that aim to provide monthly income.
• Exposure to TLT keeps the ETP linked to bond price moves.
• If TLT rises too far, gains may be capped to the strike price.
• If TLT falls, the option income may help cushion part of the drop.
Key takeaways
• TLT holds US government bonds due in 20+ years, which are typically more sensitive to interest rates than short-term bonds.
• After years of losses, inflation is lower, yields are higher, and economic data points to a slowdown – but risks remain.
• The IncomeShares TLT Options ETP aims to generate monthly income by selling calls, while keeping some exposure to TLT.
Follow IncomeShares EU for more insights.
Your capital is at risk if you invest. You could lose all your investment. Please see the full risk warning here.


De bästa lågvolatilitets ETFer på marknaden

WMMS ETF ETF en globalfond för värdeaktier

The Investment Case for TLT (Long-Dated Treasury Bonds)
AFET ETP erbjuder investerare exponering mot världens största decentraliserade AI-ekosystem

ONCE ETP spårar den schweiziska dagslåneräntan och hedgas i euro

Månadsutdelande ETFer uppdaterad med IncomeShares produkter

Utdelningar och försvarsfonder lockade i augusti

HANetfs analyserar hur ett fredsavtal kan påverka det europeiska försvaret

ADLT ETF investerar bara i riktigt långa amerikanska statsobligationer

Septembers utdelning i XACT Norden Högutdelande
-
 Nyheter4 veckor sedan
Månadsutdelande ETFer uppdaterad med IncomeShares produkter
-
 Nyheter3 veckor sedan
Utdelningar och försvarsfonder lockade i augusti
-
 Nyheter4 veckor sedan
HANetfs analyserar hur ett fredsavtal kan påverka det europeiska försvaret
-
 Nyheter4 veckor sedan
ADLT ETF investerar bara i riktigt långa amerikanska statsobligationer
-
 Nyheter2 veckor sedan
Septembers utdelning i XACT Norden Högutdelande
-

 Nyheter4 veckor sedan
Fastställd utdelning i MONTDIV augusti 2025
-

 Nyheter3 veckor sedan
HANetf kommenterar mötet mellan Kina, Ryssland och Nordkorea vid militärparad
-

 Nyheter4 veckor sedan
AICT ETF investerar i obligationer utgivna av företag från tillväxtmarknader