
Nyheter
ETC Group Crypto Market Compass #21 2024

• Cryptoassets rallye on increasing Ethereum ETF approval odds and futures short liquidations
• Our in-house “Cryptoasset Sentiment Indicator” has increased but still signals neutral levels in sentiment
• Ethereum futures short liquidations spike to the highest level since March reversing much of ETH’s underperformance vis-à-vis BTC this year
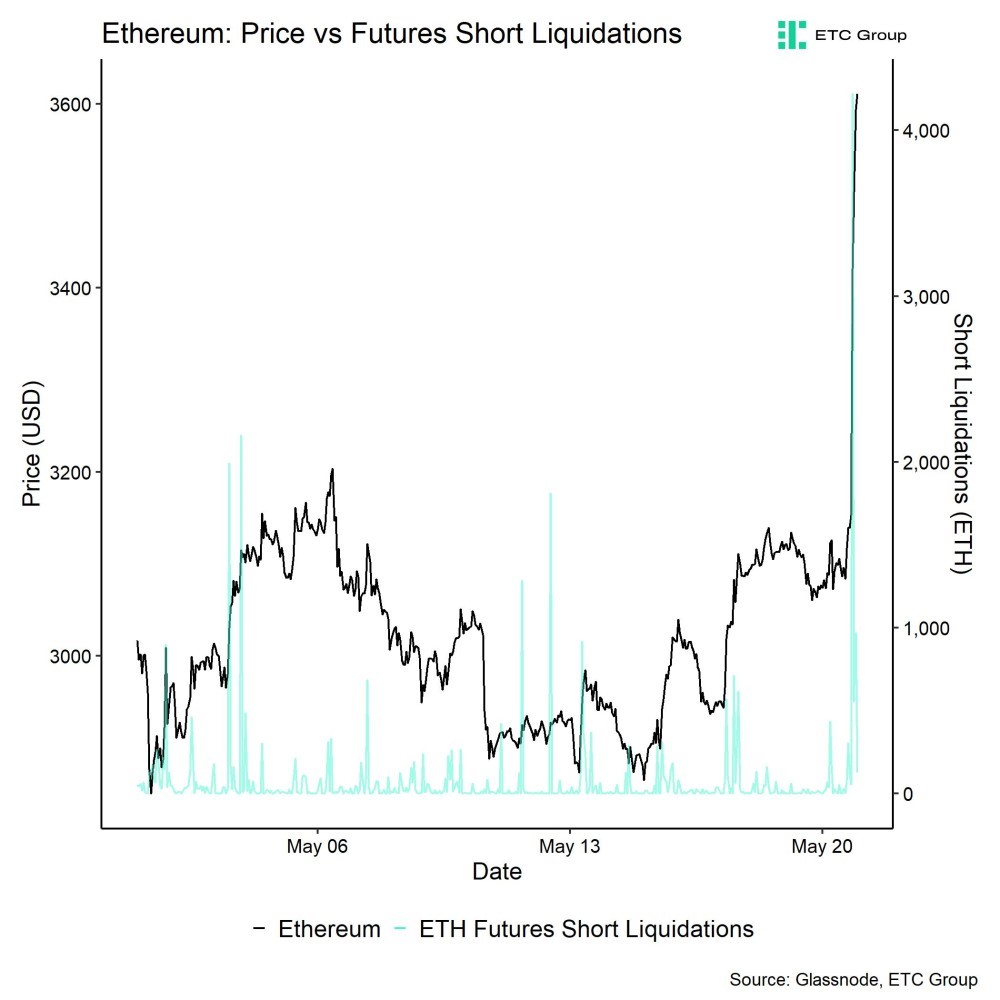
Chart of the Week
Performance

Over the past week, cryptoassets outperformed traditional assets like equities and commodities by a very wide margin buoyed by institutional buying interest and higher odds of an early Ethereum spot ETF approval in the US.
While last week accelerating net fund flows into cryptoasset ETPs and large net spot exchange outflows provided a major tailwind, this week the major focus has been on an earlier-than-expected spot Ethereum ETF approval in the US.
More specifically, it seems as if the issuers are doing last-minute revisions to their 19b-4 filings to meet the upcoming final deadline for the SEC to decide on VanEck’s application for a spot Ethereum ETF which officially ends on the 24th of May (Friday this week).
Based on the latest comments by Bloomberg ETF analysts, an approval appears to be likely by Wednesday this week already.
Except for Galaxy Digital, the applicants are comprised of the same companies that filed for a spot Bitcoin ETF as well including iShares and Fidelity.
The short-term increase in approval odds mostly came as a surprise as Bloomberg ETF analysts increased their odds from 25% originally to 75% due to the fact that the SEC asked exchanges to update the 19b-4 filings on an accelerated basis.
Polymarket – a popular betting website – is currently implying a 54% chance of an approval by the end of May, up from 10% only a couple of days ago.
The unexpected increase in approval odds also took Ethereum futures short sellers by surprise as short liquidations on Ethereum futures contracts spiked to the highest level since March (Chart-of-the-Week). This propelled Ethereum’s price higher by more than 10% within hours and reversed much of Ethereum’s underperformance vis-à-vis Bitcoin this year. Short liquidations were also a major factor behind Bitcoin’s rise past 70k USD again.

In general, among the top 10 crypto assets, Solana, Ethereum, and Avalanche were the relative outperformers.
However, overall altcoin outperformance vis-à-vis Bitcoin still remained relatively low, with only around 25% of our tracked altcoins managing to outperform Bitcoin on a weekly basis.
Sentiment
Our in-house “Cryptoasset Sentiment Index” has increased following the latest developments but overall remains at neutral levels in sentiment.
At the moment, 10 out of 15 indicators are above their short-term trend.
Last week, there were significant reversals to the upside in the 25-delta BTC option skew and the BTC futures long liquidations dominance.
That being said, the Crypto Fear & Greed Index already signals ”Extreme Greed” as of this morning.
Performance dispersion among cryptoassets has continued to remain low, i.e. most altcoins are still highly correlated with Bitcoin.
Altcoin outperformance vis-à-vis Bitcoin was also still subdued, with only around 25% of our tracked altcoins that have outperformed Bitcoin on a weekly basis despite the recent comeback of Ethereum vis-à-vis Bitcoin.
In general, increasing (decreasing) altcoin outperformance tends to be a sign of increasing (decreasing) risk appetite within cryptoasset markets.
Meanwhile, sentiment in traditional financial markets remains relatively elevated, judging by our own measure of Cross Asset Risk Appetite (CARA).
Fund Flows
Last week, we saw continued positive net inflows into global crypto ETPs with around +793.2 mn USD in net inflows across all types of cryptoassets (week ending Friday). Yesterday, we also saw very strong inflows into global crypto ETPs of around +280.2 mn USD in a single day.
Global Bitcoin ETPs saw net inflows of +826.4 mn USD last week of which +882.3 mn (net) were related to US spot Bitcoin ETFs alone. Yesterday also saw very significant inflows of around +241.1 mn USD into US spot Bitcoin ETFs. So, last week’s acceleration in fund flows seems to continue this week so far.
Hong Kong spot Bitcoin ETFs continued to experience net outflows of around -81.4 mn USD last week, according to data provided by Bloomberg.
The ETC Group Physical Bitcoin ETP (BTCE) also saw net inflows equivalent to +0.5 mn USD while the ETC Group Core Bitcoin ETP (BTC1) saw net inflows of +1.1 mn USD last week.
The Grayscale Bitcoin Trust (GBTC) continued saw minor net inflows of approximately +12.4 mn USD last week while other major US spot Bitcoin ETFs continued to attract new capital, e.g. iShares’ IBIT with net inflows of around +131.8 mn USD.
In contrast to Bitcoin ETPs, Global Ethereum ETPs continued to see declining ETP flows last week, with net outflows of around -41.7 mn USD. Yesterday we still saw continued outflows from global Ethereum ETPs of around -13.2 mn USD. This might reverse over the coming days due to the latest performance reversal in Ethereum.
Meanwhile, Hong Kong spot Ethereum ETFs that saw minor net outflows last week of around -1.5 mn USD, according to data provided by Bloomberg.
Furthermore, the ETC Group Physical Ethereum ETP (ZETH) saw minor net outflows of -0.6 mn USD last week. The ETC Group Ethereum Staking ETP (ET32) shares outstanding remained flat over the past week.
Besides, Altcoin ETPs ex Ethereum continued to see minor net inflows of around +14.5 mn USD last week.
Besides, Thematic & basket crypto ETPs still saw some minor net outflows of -5.9 mn USD, based on our calculations. The ETC Group MSCI Digital Assets Select 20 ETP (DA20) managed to attract some net inflows last week (+0.3 mn USD).
Besides, the beta of global crypto hedge funds to Bitcoin over the last 20 trading days continued to increase to around 1.09. This implies that global crypto hedge funds have significantly increased their market exposure and have currently a slightly more than neutral exposure to Bitcoin.
On-Chain Data
This week’s focus will be on Ethereum’s on-chain developments.
The general status quo of Ethereum is currently as follows: There is generally an increasing disparity between (bullish) Ethereum Layer 2 developments and (rather bearish) Layer 1 developments.
Ethereum’s stablecoin dominance has recently declined in favour of Tron. At the time of writing, Tron accounts for 55% of stablecoin transfer volumes 89% of stablecoin transfer count. Solana has recently also leapfrogged Ethereum in terms of Layer 1 network revenues for the first time ever.
In general, Ethereum’s Layer 1 network activity indicators such as active addresses or transfer count remain relatively flat relative to the start of the year.
Meanwhile, Ethereum Layer 2s are continuing to see significant increase in network activity and usage. For instance, Ethereum’s Layer 2 active users continue to increase to new all-time highs. This is mostly related to the increasing usage of Base due to Coinbase’s recent integration of the L2 within its platform.
Moreover, ETH exchange balances continue to hover near multi-year lows, and we only saw a minor uptick in aggregate ETH exchange balances, which implies net transfers to exchanges, over the past week.
Net buying minus selling volumes on exchanges over the past 7 days has recently flipped positive but still remains relatively subdued compared to the net buying volumes we saw until mid-March 2024. A positive catalyst to change this picture more significantly would certainly be an approval of the ETH spot ETFs in the US.
Futures, Options & Perpetuals
Last week, both BTC futures open interest saw a significant increase in BTC-terms which seems to be related to a net increase in long open interest. The same is true for Ethereum’s futures open interest which recently increased to the highest level since January 2023 in ETH-terms.
Meanwhile, both BTC and ETH short futures liquidations spiked significantly following the latest ETH ETF approval rumours.
The Bitcoin futures basis continues to increase from its recent lows. At the time of writing, the Bitcoin futures annualized basis rate stands at around 12.7% p.a. Perpetual funding rates also increased significantly to the highest level since early April 2024.
Bitcoin options’ open interest also increased significantly last week as BTC option traders seem to have increased their downside protection via puts as we approach earlier all-time highs again. Relative put-call volume ratios also increased significantly especially on last Sunday.
In contrast, the 25-delta BTC 1-month option skew continued to drift lower, implying an increased demand for calls relative to puts. The same is true for the ETH 1-month option 25-delta skew.
BTC option implied volatilities have increased only slightly over the past days. Implied volatilities of 1-month ATM Bitcoin options are currently at around 54.3% p.a.
In contrast, Ethereum’s 1-month implied volatilities have recently spiked significantly to year-to-date highs and are currently at around 79.2% p.a.
Bottom Line
• Cryptoassets rallye on increasing Ethereum ETF approval odds and futures short liquidations
• Our in-house “Cryptoasset Sentiment Indicator” has increased but still signals neutral levels in sentiment
• Ethereum futures short liquidations spike to the highest level since March reversing much of ETH’s underperformance vis-à-vis BTC this year
To read our Crypto Market Compass in full, please click the button below:

This is not investment advice. Capital at risk. Read the full disclaimer
© ETC Group 2019-2024 | All rights reserved


Even buying Bitcoin at its yearly peak since 2020 would still have doubled your investment, proving the power of long-term growth versus trying to time the market.


Why Solana matters: Exploring its use cases and growing adoption
Solana’s surge isn’t just market speculation; it’s driven by real-world adoption. From payments and DeFi to tokenization, the blockchain is seeing record engagement, reflected in its all-time high total value locked (TVL).


How Raydium and Jupiter are powering Solana DeFi
Raydium and Jupiter are the pillars of Solana’s DeFi ecosystem, delivering deep liquidity, seamless trading, and efficient execution that keep the network thriving. They make crypto markets faster, cheaper, and more accessible for everyone.


Research Newsletter
Each week the 21Shares Research team will publish our data-driven insights into the crypto asset world through this newsletter. Please direct any comments, questions, and words of feedback to research@21shares.com
Disclaimer
The information provided does not constitute a prospectus or other offering material and does not contain or constitute an offer to sell or a solicitation of any offer to buy securities in any jurisdiction. Some of the information published herein may contain forward-looking statements. Readers are cautioned that any such forward-looking statements are not guarantees of future performance and involve risks and uncertainties and that actual results may differ materially from those in the forward-looking statements as a result of various factors. The information contained herein may not be considered as economic, legal, tax or other advice and users are cautioned to base investment decisions or other decisions solely on the content hereof.


Time in Bitcoin beats timing Bitcoin

WMMV ETF en lågvolatilitetsfond som handlas i euro och pund
UBS AM lanserar UBS Treasury Yield Plus ETFer
COINUNI ETP spårar kryptovalutan Uniswap

ETF- och ETP-noteringar den 16 september 2025: nytt på Xetra och Börse Frankfurt

Utdelningar och försvarsfonder lockade i augusti

Månadsutdelande ETFer uppdaterad med IncomeShares produkter

HANetfs analyserar hur ett fredsavtal kan påverka det europeiska försvaret

ADLT ETF investerar bara i riktigt långa amerikanska statsobligationer

Septembers utdelning i XACT Norden Högutdelande
-
 Nyheter3 veckor sedan
Utdelningar och försvarsfonder lockade i augusti
-
 Nyheter4 veckor sedan
Månadsutdelande ETFer uppdaterad med IncomeShares produkter
-
 Nyheter4 veckor sedan
HANetfs analyserar hur ett fredsavtal kan påverka det europeiska försvaret
-
 Nyheter4 veckor sedan
ADLT ETF investerar bara i riktigt långa amerikanska statsobligationer
-
 Nyheter2 veckor sedan
Septembers utdelning i XACT Norden Högutdelande
-

 Nyheter3 veckor sedan
Fastställd utdelning i MONTDIV augusti 2025
-

 Nyheter2 veckor sedan
HANetf kommenterar mötet mellan Kina, Ryssland och Nordkorea vid militärparad
-

 Nyheter4 veckor sedan
AICT ETF investerar i obligationer utgivna av företag från tillväxtmarknader