
Nyheter
En annorlunda analys av guld
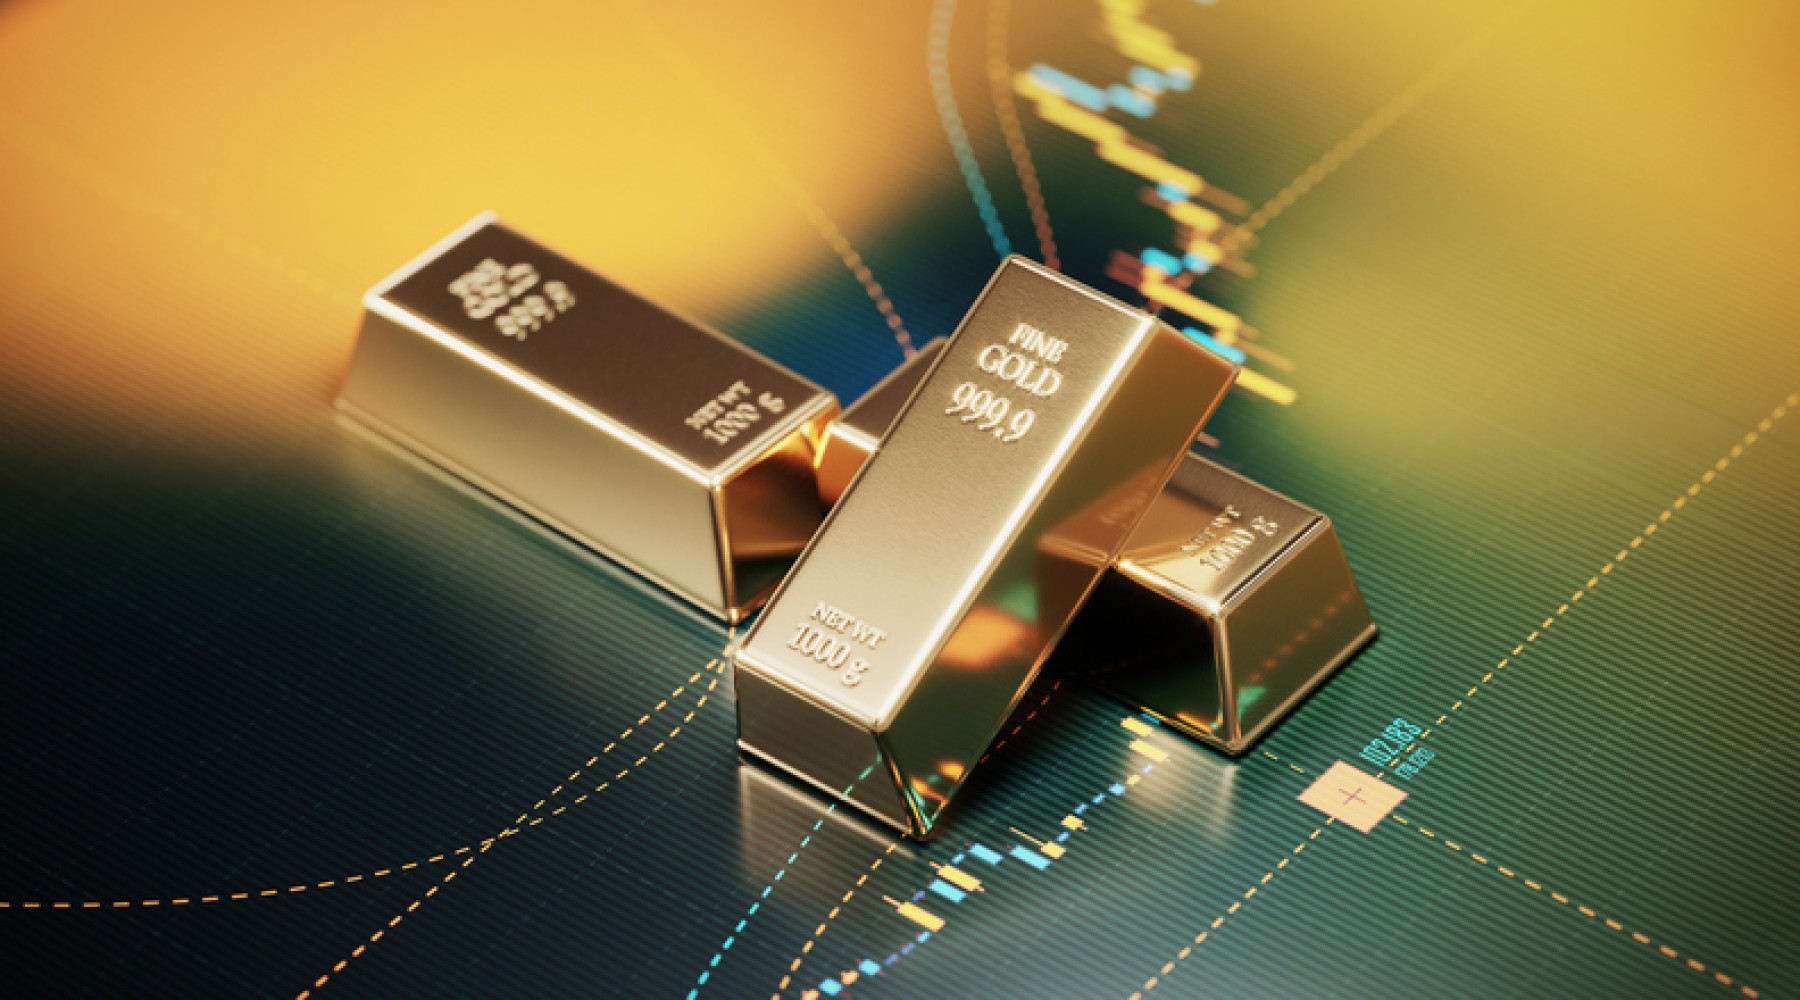
I år har guldpriset stigit med cirka 4 procent omräknat till svenska kronor. En annorlunda analys av guld. Tittar man långsiktigt sedan början av januari 2005 till och med 25 april i år har guld varit en av de bästa placeringarna i världen, se graf nedan. Uppgången summeras till 275 procent (i US-dollar). Antalet ton guld i ETF:en iShares Gold Trust (ticker IAU) har stigit från 1 ton till 180 ton under samma period.
Långsiktig utveckling

Källa: iShares, NAV-avkastning i USD i procent, avser tidsperioden 2005-01-28–2012-04-25
En annorlunda analys av guld
I år har guldpriset utvecklats positivt men sedan slutet av februari har utvecklingen varit negativ. De senaste dagarna har dock varit positiva. Tittar man på underliggande investeringsflöden är det fortfarande ökande/positiva sett utifrån årsskiftet. I nedanstående graf går det även att utläsa att antalet ton guld i ETF:en iShares Gold Trust är relativt oförändrad sedan februari.
Detta betyder att de flesta guldinvesterarna sitter still i båten. Detta kan tolkas som en fortsatt positiv tro på guld. I dagsläget handlas guldet precis under 50-dagars glidande medelvärde (”den korta trenden”) bryter guldpriset denna nivå förstärks vår positiva tro på guld. För tillgängliga ETF-alternativ, se tabell nedan.
Utveckling i år

Källa: iShares, NAV-avkastning i USD i procent, utveckling sedan årsskiftet till och med 25 april 2012
ETF-alternativ
[table id=331 /]
Källa: Factset, 27 april 2012, all avkastning i SEK


Nyheter
Interactive Brokers lanserar provisionsfria iShares ETFer från BlackRock genom Recurring Investment-funktionen i hela Europa


A1P0 ETF ger riktad exponering mot nästa generations artificiell intelligens
Interactive Brokers lanserar provisionsfria iShares ETFer från BlackRock genom Recurring Investment-funktionen i hela Europa

Nya ETF- och ETP-noteringar den 9 juni 2026 på Deutsche Börse

UONS ETF spårar den amerikanska dagslåneräntan

BlackRock lanserar ST4R ETF för att erbjuda snabb tillgång till möjligheter inom rymdekonomin

USA satsar 2 miljarder dollar på kvantdatorer – så kan investerare dra nytta av utvecklingen

De bästa ETFerna för att investera i emerging markets

Fastställd utdelning i MONTDIV maj 2026

Varför Plus500 är en dröm för finans-affiliate

Extrema skillnader: Varför presterar Europas kvantdator-ETFer så olika?
-
 Nyheter2 veckor sedan
USA satsar 2 miljarder dollar på kvantdatorer – så kan investerare dra nytta av utvecklingen
-
 Nyheter3 veckor sedan
De bästa ETFerna för att investera i emerging markets
-
 Nyheter3 veckor sedan
Fastställd utdelning i MONTDIV maj 2026
-
 Nyheter1 vecka sedan
Varför Plus500 är en dröm för finans-affiliate
-
 Nyheter1 vecka sedan
Extrema skillnader: Varför presterar Europas kvantdator-ETFer så olika?
-

 Nyheter3 veckor sedan
ASWF ETF är en aktivt förvaltad fond som investerar i Kanada
-

 Nyheter2 veckor sedan
21shares produkter nu finns tillgängliga hos Revolut
-

 Nyheter2 veckor sedan
Olja och Hormuzsundet fick flest sökningar i maj 2026