
Nyheter
Crypto Market Compass 29 July 2024
• Cryptoassets were weighed down by increasing US macro risks and a disappointing debut of the Ethereum spot ETFs. However, there was significant performance dispersion across cryptoassets as Bitcoin was buoyed by major announcement at the latest Bitcoin conference.
• Our in-house “Cryptoasset Sentiment Index” continues to signal a slightly bullish sentiment but no euphoria.
• In the short term, the Bitcoin strategic reserve announcement should already reduce the uncertainty around potential additional distribution of the current US government bitcoin holdings, which amount to around 207k BTC.
Editorial Note: The next Crypto Market Compass will be published on the 19/08/2024 due to the summer holiday season. Happy summer!
Chart of the Week
Performance
Last week, cryptoassets were weighed down by increasing US macro risks and a disappointing debut of the Ethereum spot ETFs in the US.
However, there was significant performance dispersion across cryptoassets as Bitcoin was significantly buoyed by major announcement at the latest Bitcoin conference in Nashville over the weekend.
Ethereum spot ETFs debuted on the 23rd of July. Although all new ETFs saw positive net inflows, overall net inflows were held back by larger net outflows from Grayscale’s flagship Ethereum Trust (ETHE).
More specifically, the Grayscale Ethereum Trust (ETHE) saw -1,513 mn USD in net outflows while all other new ETFs saw a combined positive net inflow of +1,170 mn USD since trading launch. As a result, Ethereum significantly underperformed Bitcoin last week.
However, we expect these net outflows from ETHE to gradually decline over time, similar to the flow pattern we observed after the Bitcoin spot ETF debut with GBTC in January this year. So, these outflows should become less of a headwind for Ethereum over next couple of weeks.
Another very important development was the Bitcoin conference in Nashville over the weekend, that saw major announcements by US politicians.
Presidential candidate Trump delivered a pro-Bitcoin speech on Saturday at the world’s largest Bitcoin conference in Nashville where he amongst other things announced plans to add Bitcoin as a strategic reserve asset, if elected as president. This was echoed by Wyoming senator Cynthia Lummis who officially presented the “Bitcoin Reserve Bill” to live conference participants as well.
Trump’s speech included the following very positive election promises:
• If elected, his administration will keep 100% of the US government’s bitcoin, forming a strategic bitcoin stockpile.
• On Day 1, he will remove SEC chairman Gary Gensler from office.
• immediately shut down “Operation Choke Point 2.0”.
• appoint a bitcoin and crypto presidential advisory council.
• design transparent regulatory clarity within the first 100 days.
• never allow a CBDC during his presidency.
• always defend the right to self-custody.
• create a framework for the safe, responsible expansion of stablecoins.
• stop the “war on crypto”.
• make the US the world’s number one bitcoin mining powerhouse.
• commute Ross Ulbricht’s sentence.
• be a pro-bitcoin president “that America needs”.
However, the price of bitcoin reacted negatively at first in a “sell-the-news” kind of fashion as a sign that a positive speech by Trump was largely anticipated. However, the price has recently surged back towards 70k USD.
It goes without saying that, if Trump were to be re-elected and if the “Bitcoin Reserve Bill” and other points were indeed implemented, this would be a very bullish catalyst for 2024 and beyond.
The latest odds by PredictIt put Trump’s probability to become the next president at 53% compared with a odds of 49% for Harris.
In the short term, the Bitcoin strategic reserve announcement should already reduce the uncertainty around potential additional distribution of the current US government bitcoin holdings. According to the latest on-chain data provided by Glassnode, the US government controls around 207k BTC and is the largest government entity worldwide holding bitcoin (Chart-of-the-Week).
The timing of these announcements coincides with the fact that today marks exactly 100 days after the Bitcoin Halving event which took place on the 20th of April.
We expect the Halving effect to become increasingly positive over the coming 300 days as outlined here and provide a significant tailwind for Bitcoin and cryptoassets throughout the remainder of 2024 and beyond.
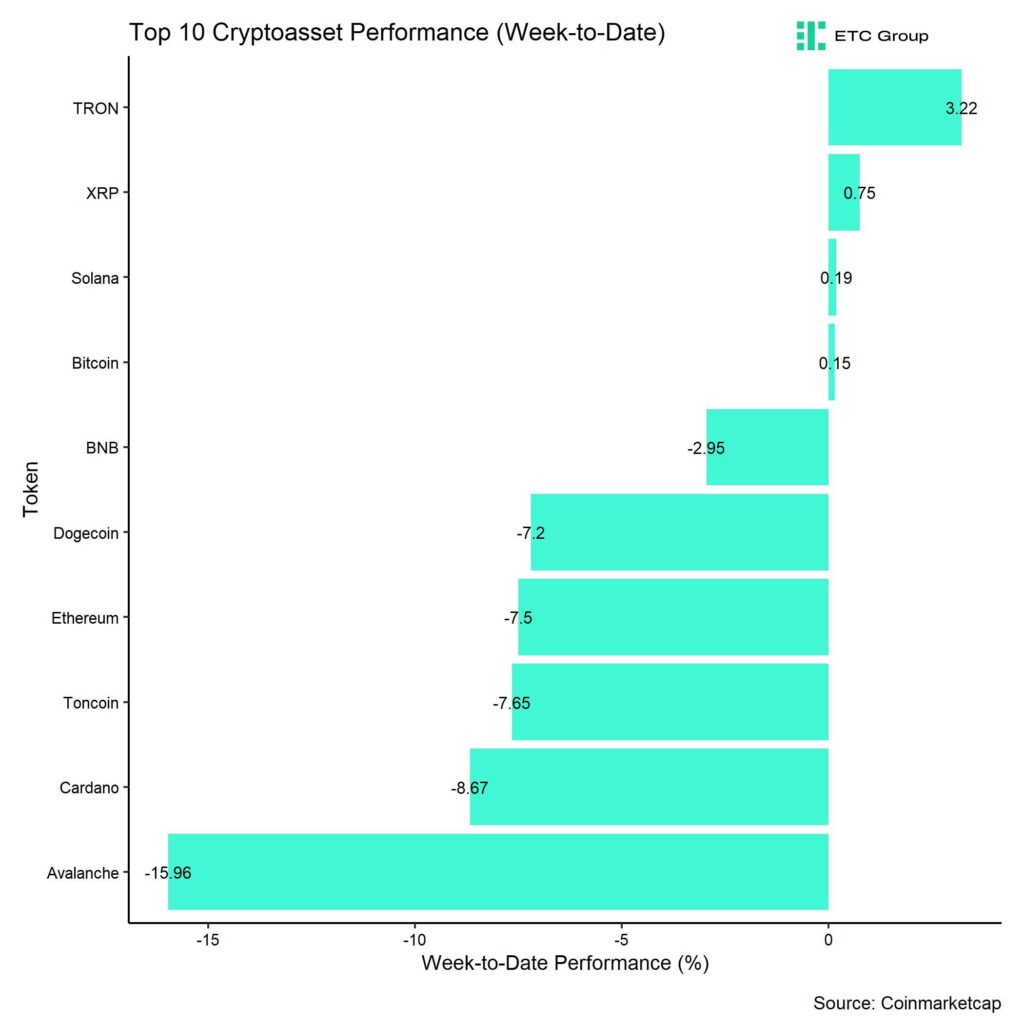
In general, among the top 10 crypto assets, TRON, XRP, and Solana were the relative outperformers.
Overall, altcoin outperformance vis-à-vis Bitcoin has continued to be low again, with only 10% of our tracked altcoins managing to outperform Bitcoin on a weekly basis. Ethereum also signficantly underperformed Bitcoin on a weekly basis.
Sentiment
Our in-house “Cryptoasset Sentiment Index” continues to signal a slightly bullish sentiment but no euphoria.
At the moment, 7 out of 15 indicators are above their short-term trend.
Last week, there were significant reversals in the BTC 1-month implied volatility and BTC perpetual funding rate which tend to be bullish signals.
The Crypto Fear & Greed Index currently signals a “Greed” level of sentiment as of this morning.
Performance dispersion among cryptoassets has decreased slightly and remains at low levels. This means that altcoins are still very much correlated with the performance of Bitcoin.
Altcoin outperformance vis-à-vis Bitcoin has continued to be low, with only 10% of our tracked altcoins outperforming Bitcoin on a weekly basis, which is consistent with the fact that Ethereum also significantly underperformed Bitcoin last week.
In general, increasing (decreasing) altcoin outperformance tends to be a sign of increasing (decreasing) risk appetite within cryptoasset markets and the latest altcoin underperformance is a signal of decreasing appetite for risk at the moment.
Meanwhile, sentiment in traditional financial markets as measured by our in-house measure of Cross Asset Risk Appetite (CARA) worsened significantly as traditional financial markets were weighed down by increasing US macro risks.
Fund Flows
Fund flows into global crypto ETPs continued to be positive but decelerated once again compared to the prior week.
Global crypto ETPs saw only around +155.4 mn USD in net inflows across all types of cryptoassets which is significantly lower than the +1,393.1 mn mn USD in net inflows recorded the prior week.
Global Bitcoin ETPs saw net inflows of +479.2 mn USD last week, of which +535.2 mn USD in net inflows were related to US spot Bitcoin ETFs alone.
Last week saw a continued deceleration in flows into Hong Kong Bitcoin ETFs to -28.9 mn USD in net outflows.
Outflows from the ETC Group Physical Bitcoin ETP (BTCE) persisted last week with net outflows equivalent to -61.8 mn USD while the ETC Group Core Bitcoin ETP (BTC1) saw minor positive net inflows of +0.1 mn USD.
The Grayscale Bitcoin Trust (GBTC) continued to see net outflows, with around -119.7 mn USD last week.
Meanwhile, global Ethereum ETPs also saw a slight deceleration in net inflows last week.
Ethereum spot ETFs debuted on the 23rd of July. Although all new US ETFs saw positive net inflows, overall net inflows were held back by larger net outflows from Grayscale’s flagship Ethereum Trust (ETHE). More specifically, the Grayscale Ethereum Trust (ETHE) saw -1,513 mn USD in net outflows while all other new ETFs saw a combined positive net inflow of +1,170 mn USD since trading launch.
In general, US spot Ethereum ETF flows have now become a significant force for global Ethereum ETP flows as well.
Hong Kong Ethereum ETFs saw sticky AuM last week (+/- 0 mn USD).
The ETC Group Physical Ethereum ETP (ZETH) also saw sticky AuM last week (+/- 0 mn USD) while the ETC Group Ethereum Staking ETP (ET32) showed a continued increase in net inflows last week (+2.2 mn USD).
Altcoin ETPs ex Ethereum also experienced positive net inflows of around +6.0 mn USD which was lower than last week though.
Thematic & basket crypto ETPs saw negative flows with around -17.9 mn USD in net outflows, based on our calculations. The ETC Group MSCI Digital Assets Select 20 ETP (DA20) saw neither in- nor outflows last week (+/- 0 mn USD).
Meanwhile, global crypto hedge funds continued to increase their market exposure again even further. The 20-days rolling beta of global crypto hedge funds’ performance increased to around 0.86 (up from 0.80 last week) per yesterday’s close.
On-Chain Data
Despite the positive news flow, Bitcoin on-chain data have deteriorated again lately.
Whale net exchange transfers have increased significantly again, with whale wallets sending around 25.3 BTC net to exchanges over the past 7 days. This could weigh on prices in the short term. Whales are defined as network entities that control at least 1,000 BTC. This could be related to Mt Gox redistributions of bitcoins, as the Mt Gox trustee wallets have sent coins to Kraken more recently.
This has significantly weighed on net buying volumes on BTC spot exchanges, which have turned negative over the past 7 days.
BTC exchange balances have also continued to stay elevated near year-to-date highs, according to data provided by Glassnode.
A significant force of selling pressure is still emanating from short-term holders (STH) and especially whales who are still realizing losses on chain. These wallets must have bought near all-time highs and are now distributing again.
A positive sign is that the Mt Gox trustee’s redistribution of bitcoins to former creditors has so far not had a significantly negative market impact. The Mt Gox trustee balance is down to 79.6k BTC from 139k BTC according to data provided by Glassnode.
Another positive sign is the fact that the continued distribution of bitcoins by the US government has now become less likely with the promises made by Trump and others at the recent Bitcoin conference in Nashville. Note that the US government had distributed bitcoins recently at the end of June. A Trump presidency would certainly decrease further distribution from these wallets. At the time of writing, the US government still controls around 207k BTC.
Lastly, a positive sign is that distributions by BTC miners has also decelerated more recently and the BTC hash rate has reached new all-time highs which is a sign that economic pressure on Bitcoin miners has receded.
We think that a large part of the “legacy supply” overhang (GBTC outflows, Mt Gox distribution, government entity sales, BTC miner distribution) has now been digested with positive market implications in terms of declining selling pressure from these entities.
Futures, Options & Perpetuals
Last week, BTC futures open interest remained mostly flat while perpetual open interest increased significantly. Futures open interest was held back due to a significant increase in BTC long liquidations while short liquidations remained moderate.
In contrast, perpetual open interest increased by around 14 BTC last week. The fact that the perpetual funding rate also increased significantly implies a net built-up in long positioning.
When the funding rate is positive (negative), long (short) positions periodically pay short (long) positions. A positive funding rate tends to be a sign of bullish sentiment in perpetual futures markets.
However, the 3-months annualized BTC futures basis rate declined compared to the week prior to around 11.2% p.a.
Besides, BTC option open interest declined due to the large expiries on the 27th of July. The recent very significant decline of the BTC put-call open interest ratio to year-to-date lows implies that BTC option traders have significantly reduced their downside hedges/bets on bitcoin which is a positive sign. Put-call volume ratios also remained somewhat low which is also consistent with the fact that 1-month 25-delta skews for BTC also declined significantly. They have recently increased again slightly though.
Meanwhile, BTC option implied volatilities have also decreased significantly. At the time of writing, implied volatilities of 1-month ATM Bitcoin options are currently at around 51.4% p.a.
Bottom Line
• Cryptoassets were weighed down by increasing US macro risks and a disappointing debut of the Ethereum spot ETFs. However, there was significant performance dispersion across cryptoassets as Bitcoin was buoyed by major announcement at the latest Bitcoin conference.
• Our in-house “Cryptoasset Sentiment Index” continues to signal a slightly bullish sentiment but no euphoria.
• In the short term, the Bitcoin strategic reserve announcement should already reduce the uncertainty around potential additional distribution of the current US government bitcoin holdings, which amount to around 207k BTC.
To read our Crypto Market Compass in full, please click the button below:

This is not investment advice. Capital at risk. Read the full disclaimer
© ETC Group 2019-2024 | All rights reserved


Nyheter
FalconX förvärvar den ledande ETP-leverantören 21shares, vilket accelererar konvergensen av digitala tillgångar och traditionell finans


Tre nya ETP från 21shares

FalconX förvärvar den ledande ETP-leverantören 21shares, vilket accelererar konvergensen av digitala tillgångar och traditionell finans

Hybridreplikering: nästa stora grej för ETFer?

31IG ETF företagsobligationer med förfall 2031

Investera i Worldcoin med en börshandlad produkt

Fokus mot en helt ny börshandlad produkt i september 2025

M5TYs senaste utdelningstakt (55 %) belyser covered call-strategins inkomstpotential
Could Bitcoin be the key to your dream house?

Börshandlade fonder för europeiska small caps
Levler noterar ytterligare fyra börshandlade fonder i Sverige
-
 Nyheter3 veckor sedan
Fokus mot en helt ny börshandlad produkt i september 2025
-
 Nyheter4 veckor sedan
M5TYs senaste utdelningstakt (55 %) belyser covered call-strategins inkomstpotential
-

 Nyheter4 veckor sedan
Could Bitcoin be the key to your dream house?
-
 Nyheter4 veckor sedan
Börshandlade fonder för europeiska small caps
-

 Nyheter2 veckor sedan
Levler noterar ytterligare fyra börshandlade fonder i Sverige
-

 Nyheter4 veckor sedan
Miners Find Their Mojo as Gold Consolidates
-

 Nyheter4 veckor sedan
State Street och Blackstone lanserar aktivt förvaltade CLO-ETFer i Europa
-

 Nyheter4 veckor sedan
Kärnkraftsavtal mellan Storbritannien och USA väcker förhoppningar om uranboom