Nyheter
Amazon Partners with Ava Labs, SEC Investigates Genesis and Gemini over Earn, and More!

Positive signals continue in crypto’s second all-positive week with the largest short squeeze in months. Bitcoin increased by 21% week-over-week and broke the 200-day moving average (SMA) threshold for the first time in 381 days. In the last bear market it took Bitcoin 386 days to trade above its 200-day SMA. Ethereum soared by 18% over the past week. Outliers of last week’s rally were Solana, Optimism, and Curve. Solana, which has increased by a whopping 46%, seems to be still enjoying the hype created by the meme token called BONK. Optimism stood out within major scalability solutions, soaring by 41%, which can be attributed to a surge in transaction volume that could have been made on the back of announcing the Shanghai testnet to be slated to take place next month. Finally, in DeFi, Curve was the first runner-up with a weekly performance of 33%.
Figure 1: Weekly TVL and Price Performance of Major Crypto Categories

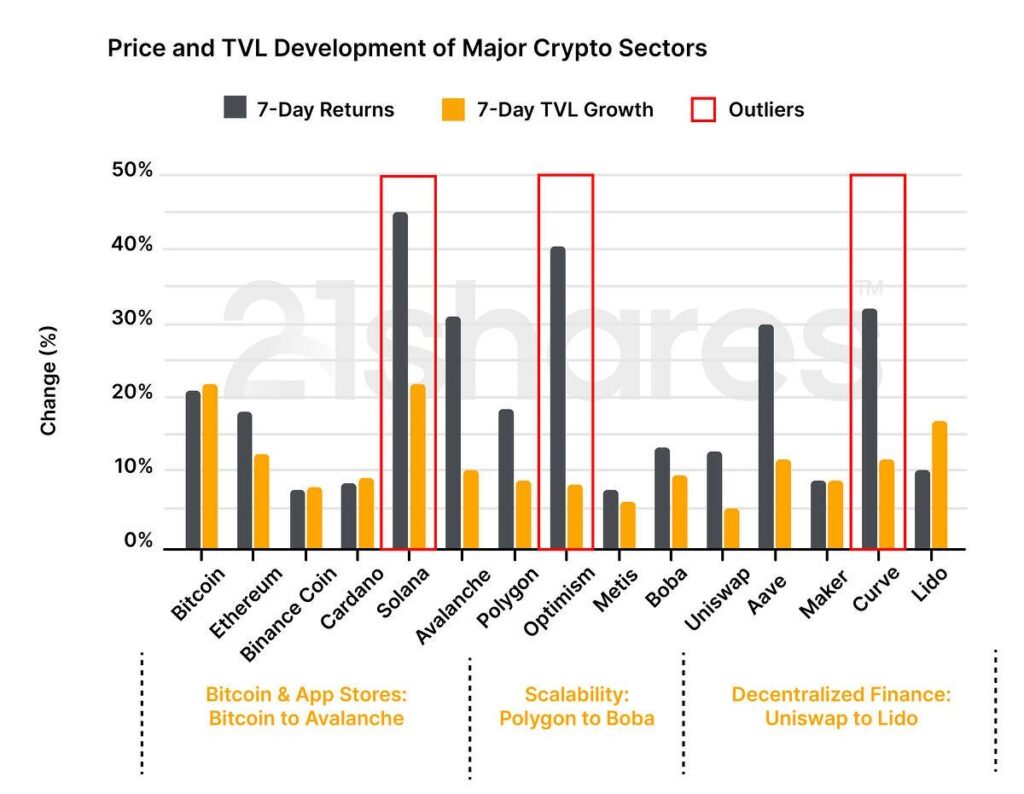
Source: 21shares, CoinGecko, DeFi Llama. Data as of January 16 (close price).
Key takeaways
• Bitcoin increased by 21% week-over-week and broke the 200-day moving average (SMA) threshold for the first time in 381 days.
• SEC launches investigations and lawsuits on Gemini and Genesis.
• Polygon proposes a network incremental improvement to address fee spikes and mitigate chain-reorganization.
• BONK, a “meme coin” creates hype on Solana-based NFT marketplace Magic Eden.
Spot and Derivatives Markets
Figure 2: Total Crypto Liquidations

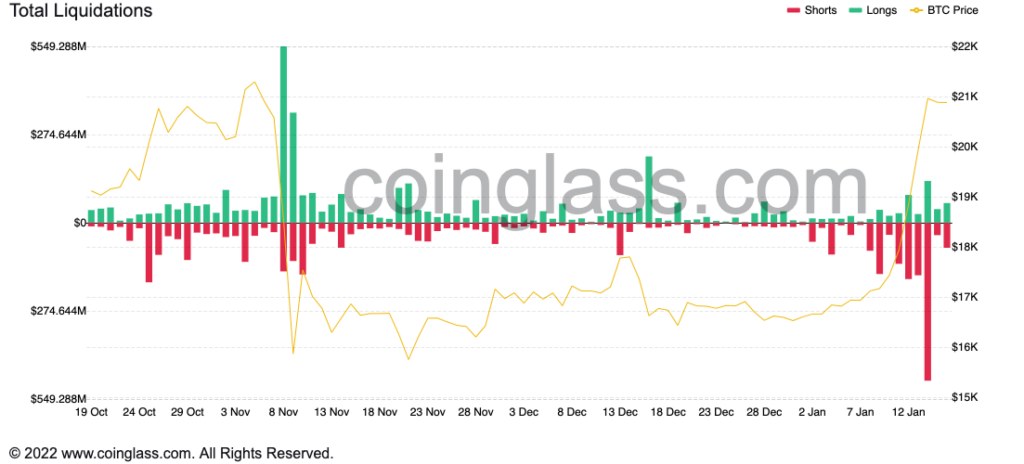
Source: Coinglass
Over the past week, we have seen the largest short squeeze in months of over $1 billion liquidated on Binance, OKX, and Bybit. This dynamic is an indication that there were more funds betting against Bitcoin and the recent positive rally disappointed their positions. The recent price action is simply a regression to the mean. We are back to levels where we were post the LUNA debacle and pre-FTX. In other words, as an industry we are better off without FTX and Alameda. However, it is important to note that this rally may not be long lasting as we may face mispriced headwinds. The silver lining is
On-chain Indicators
Figure 3: Ethereum’s Network Value to Transactions Signal

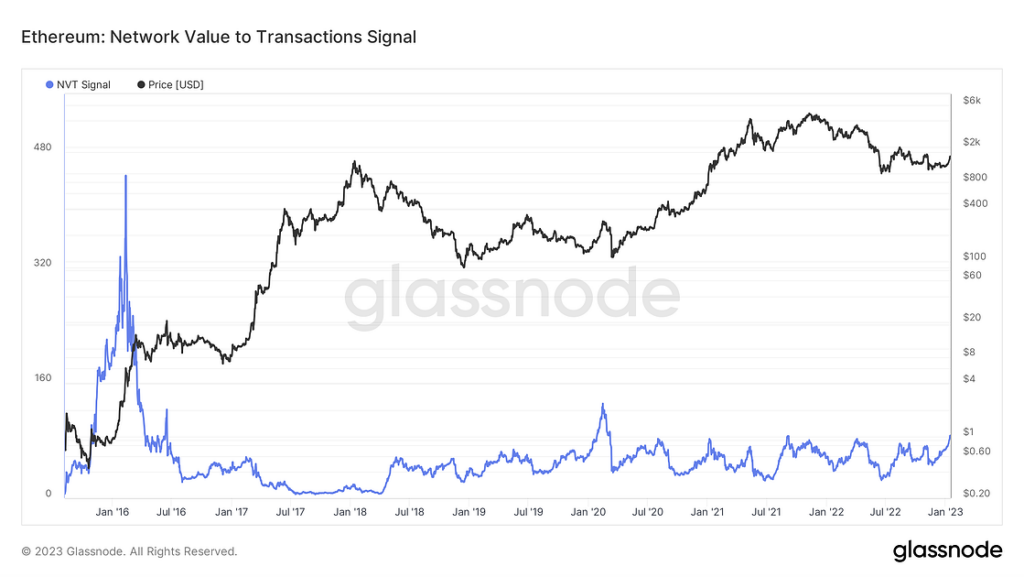
Source: Glassnode
The chart above measures the market sentiment of Ethereum, dividing its market cap by the 90-day moving average of daily transaction volume. NVTS signal closed at almost 87 on Monday, increasing by 14% week-over-week. This increase means that Ethereum’s market cap is outpacing its transaction volume, which aligns with the price movements of scalability solutions.
Next Week’s Calendar

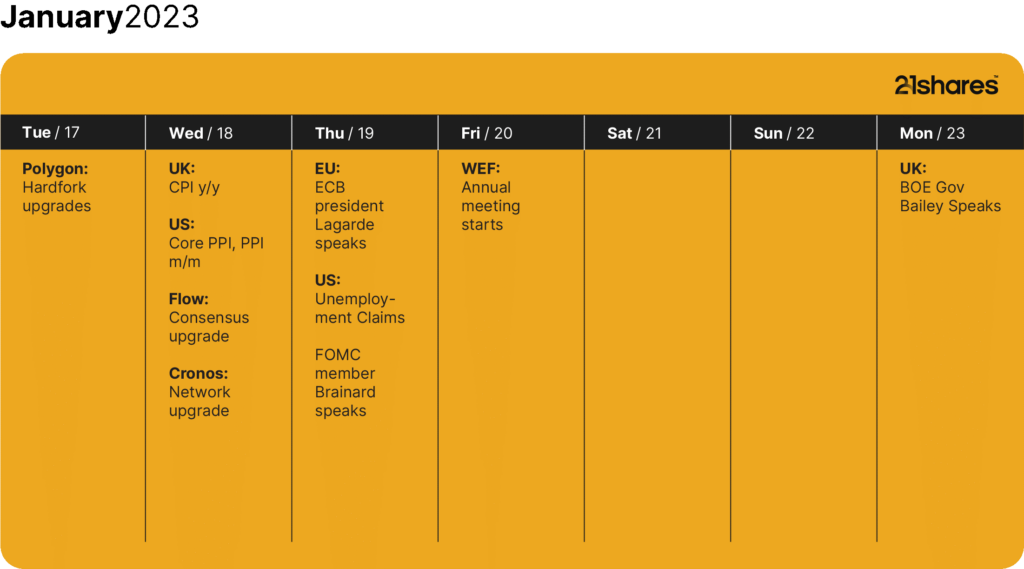
Source: Forex Factory, CoinMarketCal
Read our full report here
Research Newsletter
Each week the 21Shares Research team will publish our data-driven insights into the crypto asset world through this newsletter. Please direct any comments, questions, and words of feedback to research@21shares.com
Disclaimer
The information provided does not constitute a prospectus or other offering material and does not contain or constitute an offer to sell or a solicitation of any offer to buy securities in any jurisdiction. Some of the information published herein may contain forward-looking statements. Readers are cautioned that any such forward-looking statements are not guarantees of future performance and involve risks and uncertainties and that actual results may differ materially from those in the forward-looking statements as a result of various factors. The information contained herein may not be considered as economic, legal, tax or other advice and users are cautioned to base investment decisions or other decisions solely on the content hereof.