Följ oss

Nyheter

5 crypto trends to watch in 2025

Publicerad

den

2024 was a landmark year for bitcoin, solidifying its role as a fully institutionalised asset class. 5 crypto trends to watch in 2025

2024 was a landmark year for bitcoin, solidifying its role as a fully institutionalised asset class.

Institutional inflows into physical bitcoin exchange-traded products (ETPs) reached nearly $35 billion globally, signalling a major shift in how traditional investors view crypto. As bitcoin continued to enhance portfolios’ risk-return profiles, more institutional investors followed suit, reshaping the financial landscape.

Looking ahead, 2025 promises to bring exciting developments across the crypto ecosystem. Here are the top five crypto trends to watch.

Fear of being left behind

    The era of bitcoin as a niche investment is over. Institutional adoption is creating a ripple effect, forcing hesitant players to reconsider. Portfolios with bitcoin allocations are consistently outperforming those without, highlighting its growing importance.

    Figure 1: Bitcoin in a multi-asset portfolio

    60/40
    Global Portfolio
    1%
    Bitcoin Portfolio
    3%
    Bitcoin Portfolio
    5%
    Bitcoin Portfolio
    10%
    Bitcoin Portfolio
    MSCI AC WorldBloomberg MultiverseBitcoin
    Annualised Return5.77%6.46%7.83%9.20%12.57%9.07%0.56%56.24%
    Volatility8.79%8.86%9.14%9.62%11.42%13.94%5.05%67.28%
    Sharpe Ratio0.480.550.680.790.960.54-0.200.81
    Information Ratio1.011.011.011.00
    Beta70%71%73%75%81%100%24%181%

    Source: Bloomberg, WisdomTree. From 31 December 2013 to 30 November 2024. In USD. Based on daily returns. The 60/40 Global Portfolio is composed of 60% MSCI All Country World and 40% Bloomberg Multiverse. You cannot invest directly in an index. Historical performance is not an indication of future performance and any investment may go down in value.

    With bitcoin’s ability to noticeably improve portfolios’ risk-return profiles, asset managers face a clear choice: integrate bitcoin into multi-asset portfolios or risk falling behind in a rapidly evolving financial landscape. In 2025, expect the competition to heat up as clients demand exposure to this powerhouse cryptocurrency.

    Expanding crypto investment options

      In 2024, regulatory breakthroughs opened the doors for physical bitcoin and ether ETPs in key developed markets. This marked a critical step towards making cryptocurrencies mainstream, providing seamless access to institutional and retail investors alike.

      Figure 2: Global physical crypto ETP assets under management (AUM) and 2024 net flows

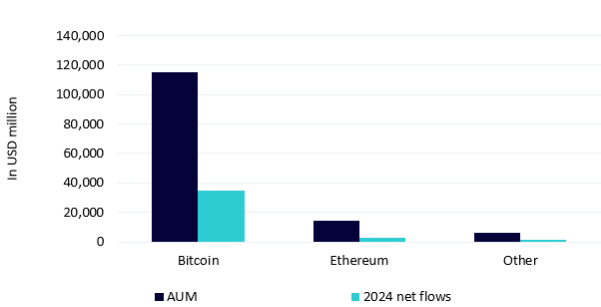
      Source: Bloomberg, WisdomTree. 02 January 2025. Historical performance is not an indication of future performance and any investment may go down in value.

      In 2025, this momentum is expected to accelerate as the crypto regulatory environment becomes more friendly in the United States and as key developed markets follow Europe’s lead and approve ETPs for altcoins such as Solana and XRP. With their clear utility and growing adoption, these altcoins are strong candidates for institutional investment vehicles.

      This next wave of altcoin ETPs will expand the diversity of crypto investment opportunities and further integrate cryptocurrencies into the global financial system.

      The maturing of Ethereum’s layer-2 ecosystem

        Ethereum’s role as the backbone of decentralised finance (DeFi), non-fungible tokens (NFTs), and Web3 is unmatched, but its scalability challenges remain a hurdle. Layer-2 solutions—technologies such as Arbitrum and Optimism—are transforming Ethereum’s scalability and usability by enabling faster, cheaper transactions.

        In 2025, Ethereum’s recent upgrades, such as Proto-Danksharding (introduced in the ‘Dencun’ upgrade), will drive layer-2 adoption even further. Innovations like Visa’s layer-2 payment platform leveraging Ethereum for instant cross-border transactions will underscore the platform’s evolution.

        Expect Ethereum’s layer-2 ecosystem to power real-world use cases ranging from tokenized assets to decentralised gaming, positioning it as the infrastructure of a truly scalable digital economy.

        Stablecoins: bridging finance and blockchain

          Stablecoins are becoming indispensable to the global financial system, offering the stability of traditional assets with the efficiency of blockchain. Platforms such as Ethereum dominate the stablecoin landscape, hosting stablecoin giants Tether (USDT) and USD Coin (USDC), which facilitate billions in daily transactions.

          Figure 3: Key stablecoin chains

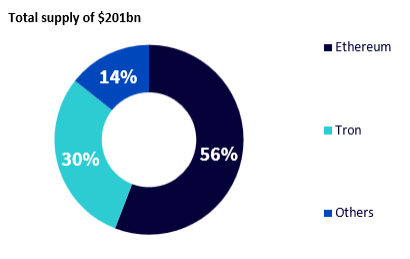
          Source: Artemis Terminal, WisdomTree. 05 January 2025. Historical performance is not an indication of future performance and any investment may go down in value.

          As we move into 2025, stablecoins will increasingly interact with blockchain ecosystems such as Solana and XRP. Solana’s high-speed, low-cost infrastructure makes it ideal for stablecoin payments and remittances, while XRP Ledger’s focus on cross-border efficiency positions it as a leader in global settlements. With institutional adoption rising and DeFi applications booming, stablecoins will serve as the backbone of a seamless, interconnected financial ecosystem.

          Tokenization: redefining ownership and revolutionising finance

            Tokenization is set to redefine how we think about ownership and value. By converting tangible assets like real estate, commodities, stocks, and art into digital tokens, tokenization breaks down barriers to entry and creates unprecedented liquidity.

            In 2025, tokenization will expand dramatically, empowering investors to own fractions of high-value assets. Platforms such as Paxos Gold and AspenCoin are already showcasing how tokenization can revolutionize markets for gold and luxury real estate. The integration of tokenized assets into DeFi will unlock new financial opportunities, such as using tokenized real estate as collateral for loans. As tokenization matures, it will transform industries ranging from private equity to venture capital, creating a more inclusive and efficient financial system.

            For the avoidance of any doubt, tokenization complements crypto by expanding the use cases of blockchain to include real-world applications.

            Looking ahead

            2025 is set to be a defining year for crypto, as innovation, regulation, and adoption converge. Whether it is bitcoin cementing its position as a portfolio staple, Ethereum scaling for mainstream use, or tokenization unlocking liquidity in untapped markets, the crypto ecosystem is poised for explosive growth. For investors and institutions alike, the opportunities have never been clearer or more compelling.

            This material is prepared by WisdomTree and its affiliates and is not intended to be relied upon as a forecast, research or investment advice, and is not a recommendation, offer or solicitation to buy or sell any securities or to adopt any investment strategy. The opinions expressed are as of the date of production and may change as subsequent conditions vary. The information and opinions contained in this material are derived from proprietary and non-proprietary sources. As such, no warranty of accuracy or reliability is given and no responsibility arising in any other way for errors and omissions (including responsibility to any person by reason of negligence) is accepted by WisdomTree, nor any affiliate, nor any of their officers, employees or agents. Reliance upon information in this material is at the sole discretion of the reader. Past performance is not a reliable indicator of future performance.

            Fortsätt läsa
            Annons
            Klicka för att kommentera

            Skriv en kommentar

            Din e-postadress kommer inte publiceras. Obligatoriska fält är märkta *

            Nyheter

            Bitcoin var den bäst presterande tillgången men…

            Publicerad

            den

            Alla säger att Bitcoin var den bäst presterande tillgången under det senaste decenniet … och det var det.

            Alla säger att Bitcoin var den bäst presterande tillgången under det senaste decenniet … och det var det.

            Men här är något som de flesta inte berättar för dig:

            Glöm aldrig bort historien

            Den bästa tillgången under ett decennium är nästan aldrig den bästa under nästa.

            Låt oss titta på de senaste 7 decennierna

            1960-talet? Amerikanska aktier var hjältarna, ledda av tillväxtföretagen ”Nifty Fifty”. Men på 1970-talet slog inflationen till hårt och samma aktier sjönk med nästan 50 %.

            1970-talet? Guldpriset steg kraftigt med över 1 400 % … och föll sedan med 50 % på 80-talet.

            1980-talet? Japans aktiemarknad exploderade … sedan kraschade den och gick in i årtionden av stagnation.

            1990-talet? Teknikaktier (Nasdaq) steg… och kollapsade sedan i dotcom-kraschen.

            2000-talet? Tillväxtmarknader och råvaror dök upp … men underpresterade sedan under 2010-talet.

            2010-talet? Bitcoin och Big Tech blev paraboliska … nu står de inför reglering, volatilitet och långsammare vinster.

            Vad är lärdomen?

            Att jaga det som var hett leder oftast till besvikelse.

            De största avkastningarna kommer ofta från platser som ingen uppmärksammar.

            Så innan du listar det senaste decenniets vinnare, fråga dig själv:

            Vart ska pucken ta vägen härnäst, inte dit den redan har varit?

            Fortsätt läsa

            Nyheter

            EQSP ETF är en likaviktad satsning på amerikanska S&P500

            Publicerad

            den

            Amundi S&P 500 Equal Weight UCITS ETF Acc (EQSP ETF) med ISIN LU2991918421, syftar till att följa S&P 500® Equal Weight-indexet. S&P 500® Equal Weight (EWI)-indexet följer amerikanska large caps, större företag och är likaviktade med en fast vikt på 0,20 %.

            Amundi S&P 500 Equal Weight UCITS ETF Acc (EQSP ETF) med ISIN LU2991918421, syftar till att följa S&P 500® Equal Weight-indexet. S&P 500® Equal Weight (EWI)-indexet följer amerikanska large caps, större företag och är likaviktade med en fast vikt på 0,20 %.

            Den börshandlade fondens totala kostnadskvot (TER) uppgår till 0,12 % per år. Amundi S&P 500 Equal Weight UCITS ETF Acc är den billigaste ETFen som följer S&P 500® Equal Weight-indexet. ETFen replikerar det underliggande indexets utveckling syntetiskt med en swap. Utdelningarna i ETFen ackumuleras och återinvesteras.

            Amundi S&P 500 Equal Weight UCITS ETF Acc är en liten ETF med 86 miljoner euro i förvaltningstillgångar. Den börshandlade fonden lanserades den 18 mars 2025 och har sitt säte i Luxemburg.

            Investeringsmål

            Amundi S&P 500 Equal Weight UCITS ETF Acc strävar efter att så nära som möjligt, oavsett om trenden är stigande eller fallande, replikera resultatet för S&P 500 Equal Weight NTR Index (indexet), och att minimera spårningsfelet mellan delfondens substansvärde och indexets resultat. Delfonden strävar efter att uppnå en spårningsfelnivå för delfonden och dess index som normalt inte överstiger 1 %.

            Handla EQSP ETF

            Amundi S&P 500 Equal Weight UCITS ETF Acc (EQSP ETF) är en europeisk börshandlad fond. Denna fond handlas på flera olika börser, till exempel Deutsche Boerse Xetra.

            Det betyder att det går att handla andelar i denna ETF genom de flesta svenska banker och Internetmäklare, till exempel  Nordnet, SAVR, DEGIRO och Avanza.

            Börsnoteringar

            BörsValutaKortnamn
            XETRAUSDEQSU
            XETRAEUREQSP
            gettexEUREQSP

            Största innehav

            Denna fond använder syntetisk replikering för att följa indexets resultat.

            NamnValutaVikt %Sektor
            UNITEDHEALTH GROUP INCUSD0.25 %Health Care
            DOLLAR TREE INCUSD0.24 %Dagligvaror
            DOLLAR GENERALUSD0.24 %Dagligvaror
            HUMANA INCUSD0.24 %Health Care
            NEWMONT CORPUSD0.23 %Materials
            CADENCE DESIGN SYS INCUSD0.23 %Informationsteknologi
            CARMAX INCUSD0.23 %Sällanköpsvaror
            COPART INCUSD0.23 %Industri
            ULTA BEAUTY INCUSD0.23 %Sällanköpsvaror
            PALANTIR TECHNOLOGIES INC-AUSD0.23 %Informationsteknologi

            Innehav kan komma att förändras

            Fortsätt läsa

            Nyheter

            April in ETFs: Gold at New Highs, Crypto in Transition, and Moat Index Holding Steady

            Publicerad

            den

            As April winds down, markets remain on edge, with escalating tariffs and renewed trade tensions keeping volatility in focus. In this summary of our full-length newsletter, we spotlight gold and gold equities, both of which have surged to record levels. We also take a step back from the day-to-day noise in crypto to explore the broader shifts in the regulatory landscape in our latest Whitepaper and present Celestia in detail. Finally, we assess how Moat indexes have held up and evolved amid the turbulence.

            As April winds down, markets remain on edge, with escalating tariffs and renewed trade tensions keeping volatility in focus. In this summary of our full-length newsletter, we spotlight gold and gold equities, both of which have surged to record levels. We also take a step back from the day-to-day noise in crypto to explore the broader shifts in the regulatory landscape in our latest Whitepaper and present Celestia in detail. Finally, we assess how Moat indexes have held up and evolved amid the turbulence.

            Your VanEck Europe team wishes you a great read.


            Featured Articles

            🥇 Are Gold Mining Equities Regaining Attention Amid Rising Gold Prices?

            Gold & Gold mining equities tend to shine during stress periods

            Source: VanEck, World Gold Council.

            Gold has attracted renewed interest from investors amid concerns about inflation, currency volatility, and overall market uncertainty. Gold mining companies have recently reported improved profit margins and cash generation, with some initiating share buybacks and maintaining relatively strong balance sheets. Despite these developments, many continue to trade below their historical valuation averages.

            While historical trends indicate that gold and gold mining equities have outperformed during certain periods of market stress, these patterns may not repeat under different economic conditions. Performance can be influenced by a range of factors including interest rates, central bank policy, geopolitical developments, and investor sentiment.

            → Read more

            ⚖️ Whitepaper Highlights: How New Crypto Regulations May Shape the Future

            Cryptocurrencies are entering a new era. With the re-election of Donald Trump and the implementation of the European Union’s Markets in Crypto-Assets (MiCA) regulation, digital assets are moving into a landscape defined not just by innovation, but also by regulatory clarity.

            MiCA’s structured and transparent approach aims to promote legitimacy, safeguard investors, and enhance trust in digital asset markets across Europe. It could also serve as a blueprint for other jurisdictions looking to regulate crypto effectively.

            → Read the Whitepaper Highlights

            ⛓️ Introduction to Celestia

            Most blockchains, like Ethereum or Bitcoin, are monolithic which means they perform all major functions (consensus, data availability, and execution) on a single layer. This design ensures security but according to new modular networks, limits scalability and flexibility.

            The modular blockchain thesis, which Celestia is leading, proposes separation of layers and respective responsibilities in the network.

            → Read more

            Note: This article in not accessible to our UK readers.

            🌊 Riding the Gold Wave

            Chasing the Vein: Fund Flows into Gold Miners

            Source: Mining.com. Data as of 21 March 2025. Note: Data covers 493 funds with combined assets under management of $62 billion.

            U.S. equity markets experienced significant declines during the month of March. Meanwhile, spot gold price recorded new all-time highs, surpassing the $3,000 per ounce mark on 14 March and closing at a record price of $3123.57 on March 31, a 9.30% ($265.73) monthly gain. As of 31 March, gold prices have risen by 93.61% over the past five years (1). Investors should keep in mind that past performance is not representative of future results.

            The gold miners, as represented by the NYSE Arca Gold Miners Index (GDMNTR), outperformed significantly, up 15.51% during March (2). This gain reflects both their operational leverage to rising gold prices and market perceptions of relative value. However, gold miners can also be subject to heightened volatility, operational risks, and sensitivity to commodity price swings.

            While gold and gold equities may serve as diversifiers in a portfolio due to their historically low correlations with many asset classes, investors should remain mindful of the inherent risks, including price volatility, currency movements, and shifts in investor sentiment that can lead to rapid reversals in performance.

            → Read more

            🌪️ Moat Stocks Weather Tariff Tumble

            Market turbulence in March weighed on stocks. The Moat Index was not immune to the market turmoil, as it declined along with the broad U.S. equity market ending the month lower. However, the Moat Index showed resilience relative to the S&P 500—thanks in part to defensive sector resilience and underweight exposure to mega-caps.

            At the same time, the SMID Moat Index lagged small and mid-caps in March. Smaller U.S. stocks were also impacted by global trade tensions and economic growth concerns with the broad small- and mid-cap benchmarks falling during the month. However, year-to-date, the SMID Moat Index remains ahead of the broader small- and mid-cap markets.

            → Read more


            This is a preview of our monthly ETF insights email newsletter.

            To receive the full version, sign up here.


            (1) Source: World Gold Council, ICE Data Services, FactSet Research Systems Inc.

            (2) Source: Financial Times.

            IMPORTANT INFORMATION

            This is marketing communication. Please refer to the prospectus of the UCITS and to the KID/KIID before making any final investment decisions. These documents are available in English and the KIDs/KIIDs in local languages and can be obtained free of charge at www.vaneck.com, from VanEck Asset Management B.V. (the “Management Company”) or, where applicable, from the relevant appointed facility agent for your country.

            For investors in Switzerland: VanEck Switzerland AG, with registered office in Genferstrasse 21, 8002 Zurich, Switzerland, has been appointed as distributor of VanEck´s products in Switzerland by the Management Company. A copy of the latest prospectus, the Articles, the Key Information Document, the annual report and semi-annual report can be found on our website www.vaneck.com or can be obtained free of charge from the representative in Switzerland: Zeidler Regulatory Services (Switzerland) AG, Neudtadtgasse 1a, 8400 Winterthur, Switzerland. Swiss paying agent: Helvetische Bank AG, Seefeldstrasse 215, CH-8008 Zürich.

            For investors in the UK: This is a marketing communication targeted to FCA regulated financial intermediaries. Retail clients should not rely on any of the information provided and should seek assistance from a financial intermediary for all investment guidance and advice. VanEck Securities UK Limited (FRN: 1002854) is an Appointed Representative of Sturgeon Ventures LLP (FRN: 452811), which is authorised and regulated by the Financial Conduct Authority (FCA) in the UK, to distribute VanEck´s products to FCA regulated firms such as financial intermediaries and Wealth Managers.

            This information originates from VanEck (Europe) GmbH, which is authorized as an EEA investment firm under MiFID under the Markets in Financial Instruments Directive (“MiFiD). VanEck (Europe) GmbH has its registered address at Kreuznacher Str. 30, 60486 Frankfurt, Germany, and has been appointed as distributor of VanEck products in Europe by the Management Company. The Management Company is incorporated under Dutch law and registered with the Dutch Authority for the Financial Markets (AFM).

            This material is only intended for general and preliminary information and shall not be construed as investment, legal or tax advice. VanEck (Europe) GmbH and its associated and affiliated companies (together “VanEck”) assume no liability with regards to any investment, divestment or retention decision on the basis of this information. The views and opinions expressed are those of the author(s) but not necessarily those of VanEck. Opinions are current as of the publication date and are subject to change with market conditions. Information provided by third party sources is believed to be reliable and have not been independently verified for accuracy or completeness and cannot be guaranteed.

            Morningstar® Wide Moat Focus IndexSM, Morningstar® US Sustainability Moat Focus Index, Morningstar® US Small-Mid Cap Moat Focus IndexSM, and Morningstar® Global Wide Moat Focus IndexSM are trademarks or service marks of Morningstar, Inc. and have been licensed for use for certain purposes by VanEck. VanEck’s ETFs are not sponsored, endorsed, sold or promoted by Morningstar, and Morningstar makes no representation regarding the advisability of investing in the ETFs. Morningstar bears no liability with respect to the ETFs or any securities.

            Effective December 15, 2023, the carbon risk rating screen was removed from the Morningstar® US Sustainability Moat Focus Index. Effective December 17, 2021, the Morningstar® Wide Moat Focus IndexTM was replaced with the Morningstar® US Sustainability Moat Focus Index. Effective June 20, 2016, Morningstar implemented several changes to the Morningstar® Wide Moat Focus Index construction rules. Among other changes, the index increased its constituent count from 20 stocks to at least 40 stocks and modified its rebalance and reconstitution methodology. These changes may result in more diversified exposure, lower turnover, and longer holding periods for index constituents than under the rules in effect prior to that date.

            NYSE Arca Gold Miners Index is a service mark of ICE Data Indices, LLC or its affiliates (“ICE Data”) and has been licensed for use by VanEck UCITS ETF plc (the “Fund”) in connection with the ETF. Neither the Fund nor the ETF is sponsored, endorsed, sold or promoted by ICE Data. ICE Data makes no representations or warranties regarding the Fund or the ETF or the ability of the NYSE Arca Gold Miners Index to track general stock market performance. ICE DATA MAKES NO EXPRESS OR IMPLIED WARRANTIES, AND HEREBY EXPRESSLY DISCLAIMS ALL WARRANTIES OF MERCHANTABILITY OR FITNESS FOR A PARTICULAR PURPOSE WITH RESPECT TO THE NYSE ARCA GOLD MINERS INDEX OR ANY DATA INCLUDED THEREIN. IN NO EVENT SHALL ICE DATA HAVE ANY LIABILITY FOR ANY SPECIAL, PUNITIVE, INDIRECT, OR CONSEQUENTIAL DAMAGES (INCLUDING LOST PROFITS), EVEN IF NOTIFIED OF THE POSSIBILITY OF SUCH DAMAGES. ICE Data Indices, LLC and its affiliates (“ICE Data”) indices and related information, the name “ICE Data”, and related trademarks, are intellectual property licensed from ICE Data, and may not be copied, used, or distributed without ICE Data’s prior written approval. The Fund has not been passed on as to its legality or suitability, and is not regulated, issued, endorsed’ sold, guaranteed, or promoted by ICE Data.

            The S&P 500 Index (“Index”) is a product of S&P Dow Jones Indices LLC and/or its affiliates and has been licensed for use by Van Eck Associates Corporation. Copyright © 2020 S&P Dow Jones Indices LLC, a division of S&P Global, Inc., and/or its affiliates. All rights reserved. Redistribution or reproduction in whole or in part are prohibited without written permission of S&P Dow Jones Indices LLC. For more information on any of S&P Dow Jones Indices LLC’s indices please visit www.spdji.com. S&P® is a registered trademark of S&P Global and Dow Jones® is a registered trademark of Dow Jones Trademark Holdings LLC. Neither S&P Dow Jones Indices LLC, Dow Jones Trademark Holdings LLC, their affiliates nor their third party licensors make any representation or warranty, express or implied, as to the ability of any index to accurately represent the asset class or market sector that it purports to represent and neither S&P Dow Jones Indices LLC, Dow Jones Trademark Holdings LLC, their affiliates nor their third party licensors shall have any liability for any errors, omissions, or interruptions of any index or the data included therein.

            It is not possible to invest directly in an index.

            Investing is subject to risk, including the possible loss of principal. Investors must buy and sell units of the UCITS on the secondary market via an intermediary (e.g. a broker) and cannot usually be sold directly back to the UCITS. Brokerage fees may incur. The buying price may exceed, or the selling price may be lower than the current net asset value. The indicative net asset value (iNAV) of the UCITS is available on Bloomberg. The Management Company may terminate the marketing of the UCITS in one or more jurisdictions. The summary of the investor rights is available in English at: complaints-procedure.pdf (vaneck.com). For any unfamiliar technical terms, please refer to ETF Glossary | VanEck.

            No part of this material may be reproduced in any form, or referred to in any other publication, without express written permission of VanEck.

            © VanEck (Europe) GmbH ©VanEck Switzerland AG © VanEck Securities UK Limited

            Fortsätt läsa

            21Shares

            Prenumerera på nyheter om ETFer

            * indicates required

            21Shares

            Populära