
Nyheter
VanEck lanserar fond för uran och kärnkraft


The iShares 20+ Year Treasury Bond ETF (TLT) holds US government bonds that mature in 20 years or more. Since peaking in March 2020 at $179.90 per share, TLT’s price is still down roughly 50%. Most of that drop happened as US inflation – and then interest rates – rose to multi-decade highs. But with inflation now below 3%, potential interest rate cuts ahead, and an interesting chart setup, the investment case for TLT could be building.
What is TLT?
The iShares 20+ Year Treasury Bond ETF (TLT) is an exchange-traded fund (ETF) that trades on the US stock market. The fund holds “long-dated” US government bonds with maturities of 20 years or more. By holding a basket of them, TLT reflects how investors generally value this part of the bond market.
Each bond in TLT is a 20-plus year loan to the US government. The investor lends money, and in return receives fixed interest payments (coupons) each year. The government sets the coupon rate when it issues (creates) a new bond, and that rate never changes. After issuance, the bond can trade on the bond market, where its price may move up or down.
What affects the value of long-dated US Treasury bonds (and TLT)?
All else being equal, long-dated Treasury bonds tend to be more volatile than shorter-dated ones. Interest rates and inflation expectations are the two main levers that can move their prices – and hence the price of TLT.
Interest rates: When rates rise, newly issued bonds pay higher coupons. Older bonds in TLT can then look relatively less attractive, so their prices may fall. When rates fall, it’s the opposite: new bonds pay lower coupons, so older bonds look “better” and may rise in price. Because TLT only holds long-dated bonds, its price tends to react more to interest rate changes than short-term bond funds. Rate shifts tend to have a bigger impact on long-dated bonds because their fixed coupons extend far into the future. Even a small change in yields can make those older coupons look much better – or much worse – for a very long time.
Inflation expectations: When investors expect higher inflation in the future, the fixed coupons (and principal) in TLT can look less valuable in today’s money. That perception can push bond prices down as investors sell bonds. And when investors think future inflation will be lower, the same coupons can look more valuable today, which may support bond prices. Because TLT’s bonds mature further into the future, inflation has more time to erode their interest and principal repayments. That’s why long-dated bonds are usually more sensitive to inflation than shorter-dated ones.
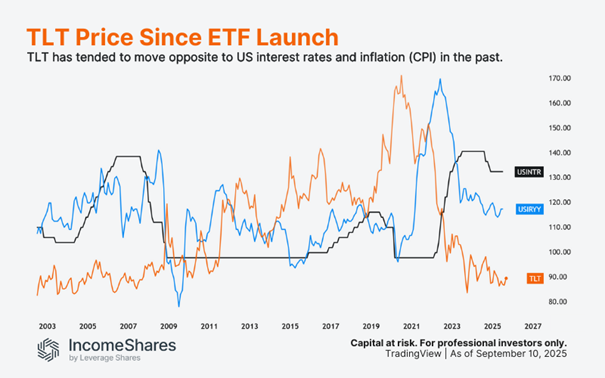
The chart below compares the price of TLT (orange) with US interest rates (black) and US inflation (blue). It’s not an exact science, but TLT has tended to move opposite to both of them since the ETF launched in 2003.
Other factors can also play a role. The US government regularly issues (creates) new bonds, and if supply goes up, prices can fall. On the demand side, big buyers like pension funds, insurance companies, or foreign central banks can move the market. Credit risk perception is also key. Investors usually see Treasuries as very low risk, but not “risk-free”. So if they lose confidence in the US government’s repayment ability, it could hurt bond prices.
The investment case for TLT today
We’ve explained how lower interest rates and lower inflation might be a better environment for long-dated US treasury bonds. As explained below, there are reasons to believe we could be moving into that environment now.
The US Federal Reserve (Fed) essentially has two jobs, and it’s a constant balancing act between the two:
- Keep inflation down (by raising interest rates to slow the economy).
- Keep employment high (by lowering interest rates to speed up the economy).
US inflation peaked above 9% in June 2022, and it’s been trending lower ever since. Inflation isn’t very low yet (2.9% CPI as of August) – but it’s low enough for the Fed to focus more on job number two. Factor in a slowing economy, and the Fed is more likely to cut interest rates from here to boost employment numbers.
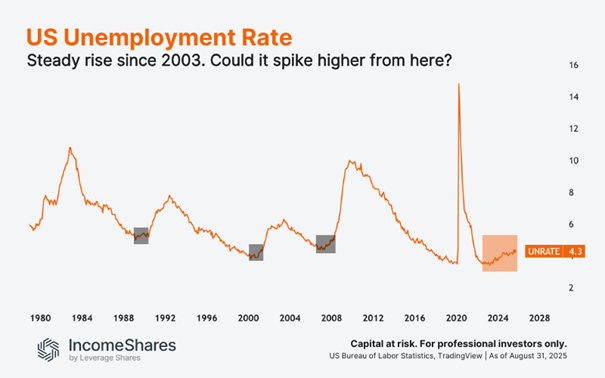
The chart below shows the US unemployment rate in orange. It’s now at 4.3% (August) – the highest unemployment rate since November 2021. In the past, unemployment rose gradually at first, before eventually breaking much higher. If that pattern repeats, we could see a bigger spike in unemployment.
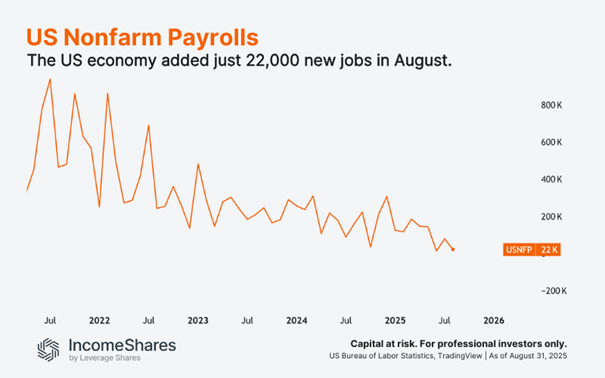
Not only is the unemployment rate rising, but the number of new job openings is dropping, too. US nonfarm payrolls (new jobs excluding farming, private households, non-profits, and the military) showed that the US economy added just 22,000 new jobs in August.
And to make matters worse, the government also revised its earlier estimates down. The adjustment meant the US added around 911,000 fewer jobs in the year through March 2025 than first reported.
AI could also factor into these numbers. After all, companies are rolling out AI tech to improve productivity – and that puts pressure on the “human” job market. AI can also make goods and services cheaper to produce, which is inherently disinflationary (the opposite of inflation).
This setup could give the Fed more ammo for bigger rate cuts in the future. Throw in lower inflation, and we could see a solid backdrop for TLT.
The technical picture for TLT
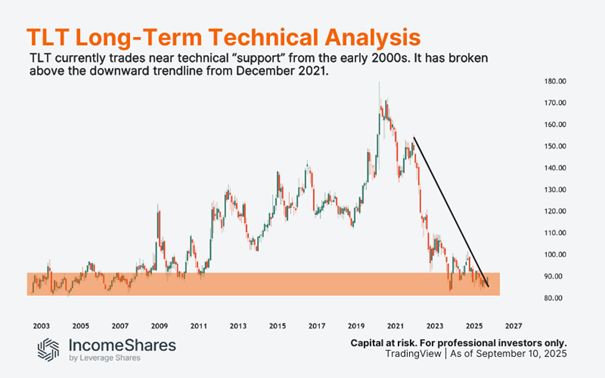
Not many assets are trading near 20-year lows. But as the chart below shows, TLT is trading near technical “support” from the early 2000s (orange). Also note that TLT recently broke above a downward sloping trendline that’s been in play since December 2021. This may signal that selling pressure is easing, and buyers are stepping in.
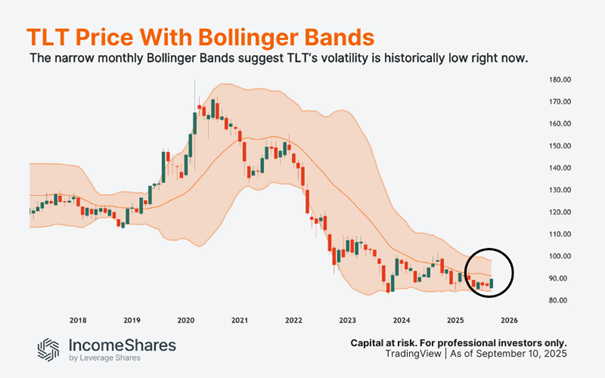
The chart below shows Bollinger Bands around TLT’s price. Here, the middle band is TLT’s 20-month average price, and each red or green candle represents one month of price movement for TLT.
The further the outer bands are from the middle band, the more volatile TLT’s price, according to the indicator. At this point, the Bollinger Bands are pinching together – a sign of relatively low volatility for TLT. Volatility tends to be “mean reverting” – meaning it usually cycles from periods of lower volatility to higher volatility. If the bands now start to widen, and the price trends higher, we could see a sustained rally for TLT.
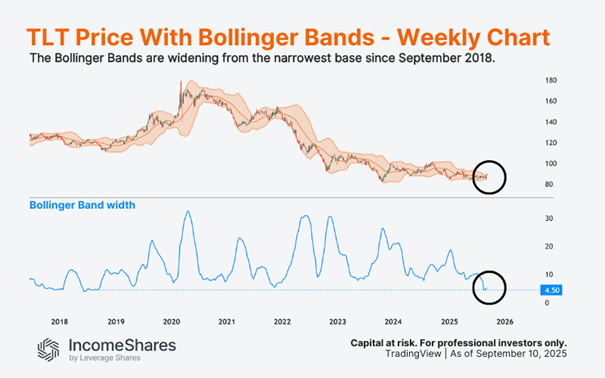
The next chart zooms into the weekly timeframe, where each red or green candle represents one week of price movement for TLT. In this case, the Bollinger band width represents the volatility of TLT around its 20-week moving average. The blue line underneath it shows the width of the Bollinger Bands – lower is narrower, and less volatility.
Last month, the Bollinger Bands reached their narrowest level since September 2018. In other words, TLT’s volatility reached its lowest level in seven years, according to the indicator. Now notice how the bands started expanding this month – from that very low volatility base. This suggests TLT could see more volatility going into the end of 2025. Keep in mind that volatility is direction neutral.
Risks
The investment case for TLT depends heavily on inflation staying low and the Fed being willing to cut rates. If inflation rises again, TLT may fall further. Heavy government borrowing could also pressure Treasuries if investors demand more compensation to buy the debt. And if the economy holds up better than expected, the Fed might not need to cut rates.
How IncomeShares ties in
The IncomeShares 20+ Year Treasury Options ETP holds TLT and sells call options on it.
• Selling calls generates option premiums that aim to provide monthly income.
• Exposure to TLT keeps the ETP linked to bond price moves.
• If TLT rises too far, gains may be capped to the strike price.
• If TLT falls, the option income may help cushion part of the drop.
Key takeaways
• TLT holds US government bonds due in 20+ years, which are typically more sensitive to interest rates than short-term bonds.
• After years of losses, inflation is lower, yields are higher, and economic data points to a slowdown – but risks remain.
• The IncomeShares TLT Options ETP aims to generate monthly income by selling calls, while keeping some exposure to TLT.
Follow IncomeShares EU for more insights.
Your capital is at risk if you invest. You could lose all your investment. Please see the full risk warning here.


De bästa lågvolatilitets ETFer på marknaden

WMMS ETF ETF en globalfond för värdeaktier

The Investment Case for TLT (Long-Dated Treasury Bonds)
AFET ETP erbjuder investerare exponering mot världens största decentraliserade AI-ekosystem

ONCE ETP spårar den schweiziska dagslåneräntan och hedgas i euro

Månadsutdelande ETFer uppdaterad med IncomeShares produkter

Utdelningar och försvarsfonder lockade i augusti

HANetfs analyserar hur ett fredsavtal kan påverka det europeiska försvaret

ADLT ETF investerar bara i riktigt långa amerikanska statsobligationer

Septembers utdelning i XACT Norden Högutdelande
-
 Nyheter4 veckor sedan
Månadsutdelande ETFer uppdaterad med IncomeShares produkter
-
 Nyheter3 veckor sedan
Utdelningar och försvarsfonder lockade i augusti
-
 Nyheter4 veckor sedan
HANetfs analyserar hur ett fredsavtal kan påverka det europeiska försvaret
-
 Nyheter4 veckor sedan
ADLT ETF investerar bara i riktigt långa amerikanska statsobligationer
-
 Nyheter2 veckor sedan
Septembers utdelning i XACT Norden Högutdelande
-

 Nyheter4 veckor sedan
Fastställd utdelning i MONTDIV augusti 2025
-

 Nyheter3 veckor sedan
HANetf kommenterar mötet mellan Kina, Ryssland och Nordkorea vid militärparad
-

 Nyheter4 veckor sedan
AICT ETF investerar i obligationer utgivna av företag från tillväxtmarknader