
Nyheter
SC0H ETF investerar i aktier med fokus på USA


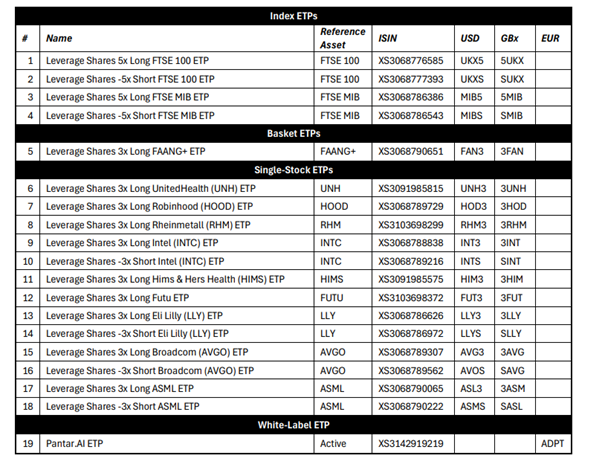
Leverage Shares, en pionjär och ledande emittent av börshandlade produkter (ETP) med cirka 1,5 miljarder dollar i förvaltat kapital (AUM)1, tillkännagav i går lanseringen av 19 nya 5x ETPer på Londonbörsen.
Den senaste expansionen omfattar större index och introducerar de första 3x leveraged ETPerna någonsin på Robinhood (HOOD), Hims & Hers (HIMS) och UnitedHealth (UNH), tillsammans med nya leveraged och inversa exponeringar mot globala ledare som Intel, Broadcom och ASML.
Leverage Shares fortsätter att se rekordstor handel på sina ETP:er:
- Omsättningen hittills till och med augusti 2025 har ökat med +86 % jämfört med 2024.
- Genomsnittlig månatlig handel har ökat med nästan 50 % jämfört med förra året.
- TSL3 (3x Tesla) var Londonbörsens mest omsatta ETP (efter affärer) under tre år i rad (2022–2024)3.
- Oktay Kavrak, chef för kommunikation och strategi på Leverage Shares, kommenterade lanseringen: ”Efterfrågan på leveraged och inverse ETP:er fortsätter att växa då investerare vill handla på båda sidor av marknaden. Med rekordhandelsaktivitet och denna senaste expansion förstärker Leverage Shares sin roll som den självklara plattformen för aktiva handlare som söker precision, valmöjligheter och transparens.”
Om Leverage Shares
Leverage Shares är pionjären och den största utgivaren av ETP:er för enskilda aktier i Europa2. Företaget, som vann International Financial Awards (Bästa ETP-leverantör 2021), lanserades 2017 och har över 180 ETP:er som erbjuder både hävstångs- och icke-hävstångsexponering mot enskilda aktier, ETP:er och råvaror. Dess kärnverksamheter inkluderar:
- Hävstångs- och inversa ETP:er – det bredaste utbudet av hävstångsprodukter för enskilda aktier i Europa.
- IncomeShares – EU:s första optionsbaserade inkomst-ETP:er på enskilda aktier, råvaror och index.
- White Label Solutions – en plattform för tredje part att lansera sina egna varumärkes-ETPer.
Prospektet för LeverageShares har godkänts av Irlands centralbank som behörig myndighet enligt förordning (EU) 2017/1129 och av Financial Conduct Authority som behörig myndighet enligt Storbritanniens version av förordning (EU) nr 2017/1129, vilken är en del av brittisk lag enligt Europeiska unionens utträdeslag 2018.
För mer information, besök https://leverageshares.com/en-eu/
- Källa: Bloomberg, per den 31 januari 2025.
- Källa: LeverageShares, per förvaltat kapital, per den 31 augusti 2025.
- Källa: London Stock Exchange, faktablad om börshandlade produkter.


Leverage Shares presenterar nya 5x ETPer på större index och globala aktier

IN0A ETF spårar S&P 500 med fokus på företag med höga ESG-betyg
PLTY ETP utfärdar optioner mot aktier i Palantir

IVAI ETF för den som tror på Artificiell intelligens

COINSOL ETP spårar kryptovalutan Solana

Utdelningar och försvarsfonder lockade i augusti

Månadsutdelande ETFer uppdaterad med IncomeShares produkter

HANetfs analyserar hur ett fredsavtal kan påverka det europeiska försvaret

ADLT ETF investerar bara i riktigt långa amerikanska statsobligationer

Septembers utdelning i XACT Norden Högutdelande
-
 Nyheter2 veckor sedan
Utdelningar och försvarsfonder lockade i augusti
-
 Nyheter3 veckor sedan
Månadsutdelande ETFer uppdaterad med IncomeShares produkter
-
 Nyheter4 veckor sedan
HANetfs analyserar hur ett fredsavtal kan påverka det europeiska försvaret
-
 Nyheter4 veckor sedan
ADLT ETF investerar bara i riktigt långa amerikanska statsobligationer
-
 Nyheter2 veckor sedan
Septembers utdelning i XACT Norden Högutdelande
-

 Nyheter3 veckor sedan
Fastställd utdelning i MONTDIV augusti 2025
-

 Nyheter2 veckor sedan
HANetf kommenterar mötet mellan Kina, Ryssland och Nordkorea vid militärparad
-

 Nyheter3 veckor sedan
AICT ETF investerar i obligationer utgivna av företag från tillväxtmarknader