Följ oss

Nyheter

How Will Solana’s Token Upgrade Boost Adoption Rate?

Publicerad

den

Solana's Token The year started with, first, a regulatory landmark for Bitcoin, second, a reminder that inflation hadn’t cooled in December and that a downturn in the economy might still be underway in Europe. In this monthly review, we’ll discuss the following trends shaking the market:

The year started with, first, a regulatory landmark for Bitcoin, second, a reminder that inflation hadn’t cooled in December and that a downturn in the economy might still be underway in Europe. In this monthly review, we’ll discuss the following trends shaking the market:

• All Eyes on Rate Cuts, Albeit Sticky Inflation

• Bitcoin Warms Up to its Wall Street Moment

• Solana Flirts with Compliance, Unveils Token Standard

• Ethereum Solidifies its Presence

• Layer 2s Roll Up Sleeves Ahead of Settlement Layer Upgrades

All Eyes on Rate Cuts, Albeit Sticky Inflation

Europe’s annual inflation increased by 3.4% in December. The European Central Bank (ECB) decided to keep the three key interest rates unchanged, bracing itself for a downtrend expected to continue in 2024. With energy inflation in the negative since May 2023, food inflation remains sticky at 6%. With more than 500 ships already taking a detour, unrest in the Red Sea is one of the factors the ECB fears will affect consumer prices if the conflict persists. If not, rate cuts could commence in June.

In the U.S., investors expected the first of three signaled rate cuts to happen as early as March. However, the country’s annual inflation increased by 3.4% in December, the most in three months. Housing, clothing, and car prices are the major contributors to the sticky inflation that has dimmed rate-cut expectations. On January 31, the Federal Open Market Committee (FOMC) decided it would keep interest rates steady. Given inflation is well above the Fed’s 2% target, it indicated that it isn’t ready to cut rates.

On the upside, unemployment claims have dropped to 187K, the lowest since September 2022 – which could clear out recession fears. On that note, the U.S. equities market has been moving sideways in January, dropping after the Fed’s rates decision; the S&P 500 and Nasdaq Composite have increased by ~2% and ~2.7%, respectively, over the past month.

Bitcoin Warms Up to its Wall Street Moment

Seeing $4.6 billion in volume on the first day of trading, 11 spot Bitcoin exchange-traded funds (ETFs) were finally approved in the U.S. even to flip silver, becoming the world’s second-largest commodity by assets under management. While spot Bitcoin products have been present on European stock exchanges for the past five years, their introduction in the U.S. marks a significant milestone. Valued at $45 trillion, American markets are nearly three times larger than their European counterparts, valued at $13 trillion. This paves the way for much broader adoption, solidifying crypto as a legitimate asset class that can seamlessly integrate into the traditional portfolios of the largest asset managers in the world.

Since launch, more than $29 billion have been traded on the products, with total inflows surpassing $1 billion. After successfully switching from a closed-end fund to a spot product, Grayscale’s ETF saw more than $5 billion in redemptions, with nearly a billion being attributed to FTX’s estate bankruptcy liquidations. The underlying asset in question, however, had a bumpy monthly performance. As shown in Figure 1, Bitcoin broke the $49K mark and declined shortly after to $43K, dipping by 3.6% in January. This drop can be due to inflationary pressures and profit-taking measures – especially those linked to bankruptcy proceedings.

Figure 1: Spot Bitcoin ETF Flows
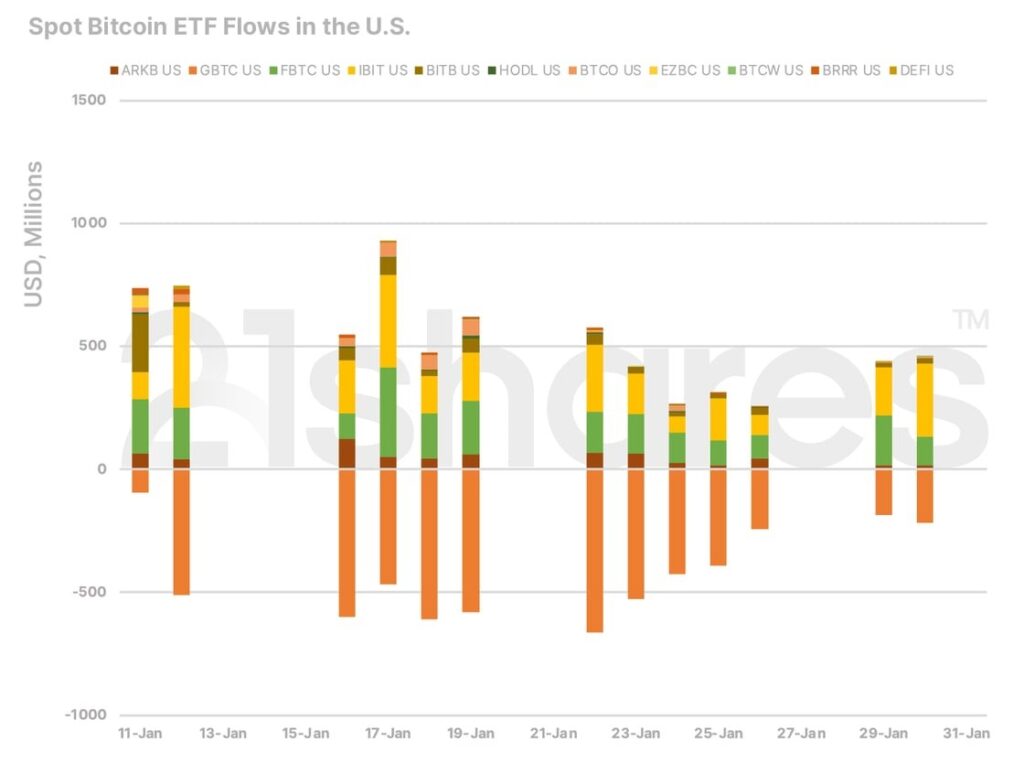
Source: 21Shares

Solana Flirts with Compliance, Unveils Token Standard

Increasing by ~300% in 2023, Solana picked up the pace at the end of January thanks to the airdrop of WEN, a new “meme coin” listed on Jupiter, Solana’s largest decentralized exchange, which released its own governance token on January 31, potentially inviting even more hype to the network. New addresses have surged by 52.5% since WEN’s airdrop. Frenzy aside, there’s more to unpack on Solana’s backend.

On January 24, Solana unveiled token extensions, a set of features to enhance Solana’s existing token standard, Token2022. The upgrade, which introduces 13 new standards in total, includes the ability to introduce confidential transfers to shield transfer amounts for privacy purposes, an interest-bearing standard to generate royalties on tokens, and permissioned tokens that implement access control for specific users and entities. These enhancements are tailored to meet the demands of businesses seeking to construct sophisticated and adaptable tokens that adhere to regulatory standards.

That said, the upgrade strategically places Solana in a prime position to assume a more influential role in tokenization, enhancing the network’s ability to meet the diverse needs of enterprises effectively. Additionally, this development is crucial as it establishes Solana’s competitiveness in a domain that was captivated by Ethereum over the past two years. A degree of dominance is attributed to Ethereum’s reliance on a set of customizable standards, such as ERC3643, which can be explored further in our tokenization report. Finally, the network’s increasing enthusiasm and widespread adoption become evident when analyzing its daily active users, illustrated in Figure 2 below.

Figure 2: Comparison of Daily Active Users between Leading Smart Contracts and Scaling Platforms

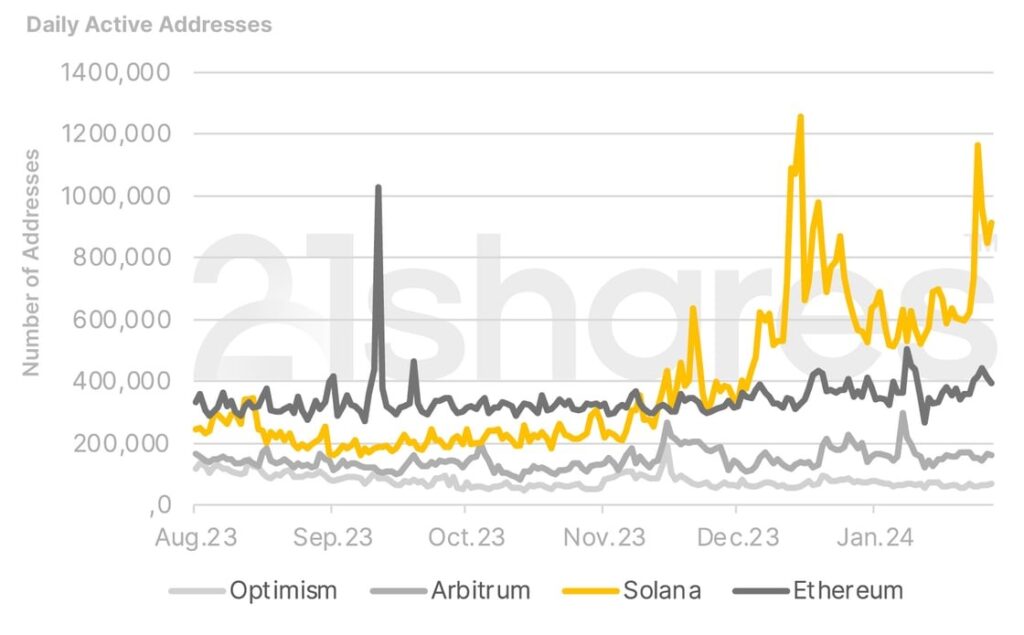
Source: 21Shares, Artemis

Ethereum Solidifies its Presence

Following the eagerly awaited approval of the BTC Spot ETF in the United States, Ethereum began overperforming, potentially signaling what might unfold next in the market. Namely, investors may have started to speculate on a Spot Ethereum ETF, as Ethereum could be in a favorable position due to the existence of an ETH futures ETF in the U.S. – a reminiscent feature of Bitcoin’s position ahead of the SEC approval. This belief prompted the second-largest cryptocurrency to surge by 15% shortly after the approval, only to retrace those gains in the subsequent days. However, the anticipation surrounding the next U.S. ETF approval is not the sole source of excitement for Ethereum, especially as the network approaches its next major upgrade.

Dubbed Dencun, the network’s refinement aims to slash gas fees for Ethereum’s scaling solutions by nearly 90%. This will be achieved by introducing what’s known as data blobs, a novel data container that efficiently carries substantial amounts of data at a lower verification cost. This breakthrough is poised to significantly reduce settlement costs for rollup networks such as Arbitrum, Optimism, and Polygon.

With the successful completion of the first dress rehearsal on the Goerli Testnet, the path is now paved for two additional trial runs on January 30 and February 7, leading to a mainnet deployment expected in late March. This upgrade is pivotal, standing out as a key driver of excitement around Ethereum and its extensive ecosystem of scaling solutions, as evidenced by the network’s surging daily transactions reaching a multi-year high in Figure 3 below.

Figure 3: Daily Transactions on Ethereum
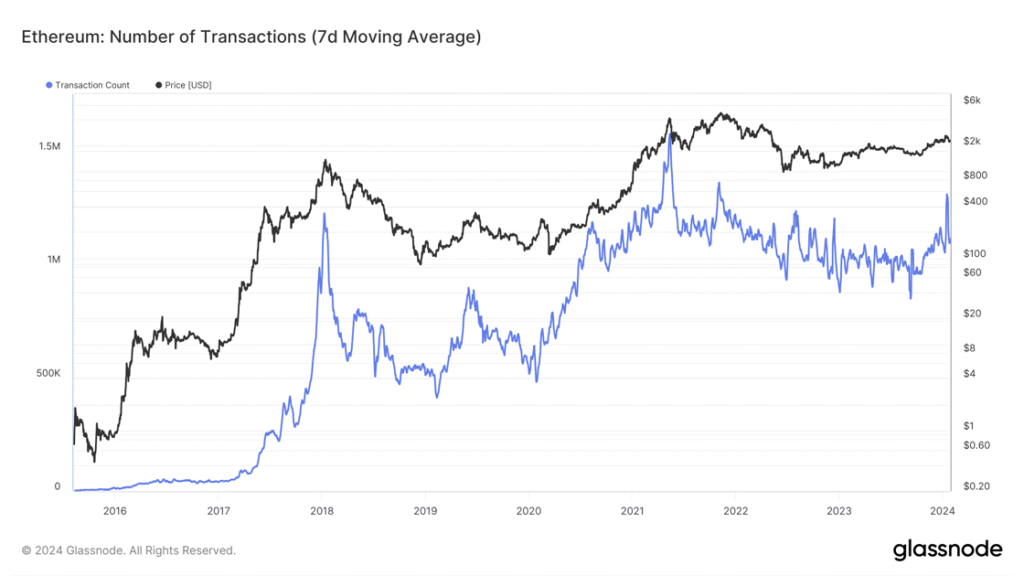
Source: Glassnode

Layer 2s Roll Up Sleeves Ahead of Settlement Layer Upgrades

For instance, Polygon intensified its focus on the modular Chain Development Kits (CDK) solution, allowing businesses to craft their own adaptable blockchains as a strategic move to advance its tokenization initiatives. A notable example is Libre, a CDK-based protocol tailored for institutions that provides compliant issuance and automated lifecycle management of alternative investments. Hamilton Lane and Brevan Howard are its inaugural adopters.

Furthermore, Polygon pushed ahead with its vision for shared liquidity by introducing AggLayer. A solution that aims to interconnect all CDK-based networks through ZeroKnowledge proofs, facilitating unified liquidity across its ecosystem. This development positions Polygon distinctly in comparison to similar modular networks such as Arbitrum and Optimism. Finally, Polygon unveiled that its zkEVM network has been upgraded into a Type2 EVM-compatible network, meaning that developers can now deploy their code on Polygon zkEVM exactly as it is on Ethereum without any additional auditing or modifications necessary.

Conversely, Arbitrum announced that its custom blockchain development solution, Orbit, will enable networks built on top of its framework to designate their tokens as gas currencies, a departure from the conventional reliance on ETH once they fulfill a specific criterion. This upgrade ensures that networks utilizing Orbit can establish utility for their tokens, accompanied by advanced features like gas subsidy. The remarkable flexibility provided by Orbit places Arbitrum on equal footing with platforms like Cosmos, making it a more appealing choice for developers seeking flexibility in their blockchain development decisions. However, even if users choose to transact with alternative currencies on Arbitrum-based networks, potentially reducing demand for ETH in user transactions, it’s important to highlight that Arbitrum’s validators (sequencers) are still required to settle transactions on Ethereum using ETH. This implies that the demand for ETH as a settlement currency won’t be significantly diminished for networks that opt for this method.

To recap, with Ethereum’s gas fees peaking at an average of 156 GWEI (around $6.5) in 2023, the Dencun upgrade couldn’t have come at a more opportune moment to streamline the user experience for those preferring to remain within Ethereum’s ecosystem to benefit from its network effects and liquidity advantages. This is a reality that we at 21Shares believe will inspire Ethereum competitors to contemplate transitioning to Layer 2 solutions. This thesis can be further explored in our market outlook for 2024.

This strategic shift enables ETH alternatives to tap into Ethereum’s vibrant and sticky user base and provides an opportunity to maximize profits by leveraging the network’s coveted blockspace. This point holds particular relevance for networks like Solana, which presently face challenges in achieving profitability due to the network’s minimal fees and high levels of subsidization.

With that in mind, the business model success of scaling networks is clearly illustrated in Figure 4 below, highlighting their ability to generate substantial profits even after the costly data submission on the Ethereum mainnet. Nevertheless, the responsibility lies in scaling solutions to distinguish themselves and incorporate a range of features that appeal to the distinct use cases within their respective networks.

Figure 4: Monthly Net Profits of Ethereum Scaling Solutions
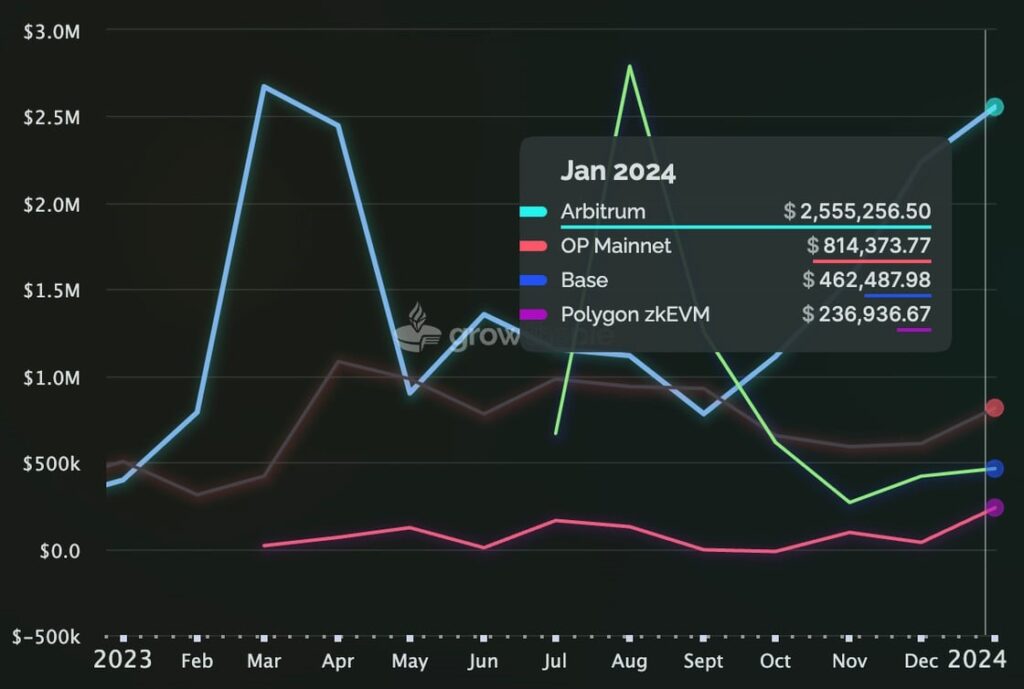
Source: GrowThePie

Next Month’s Calendar

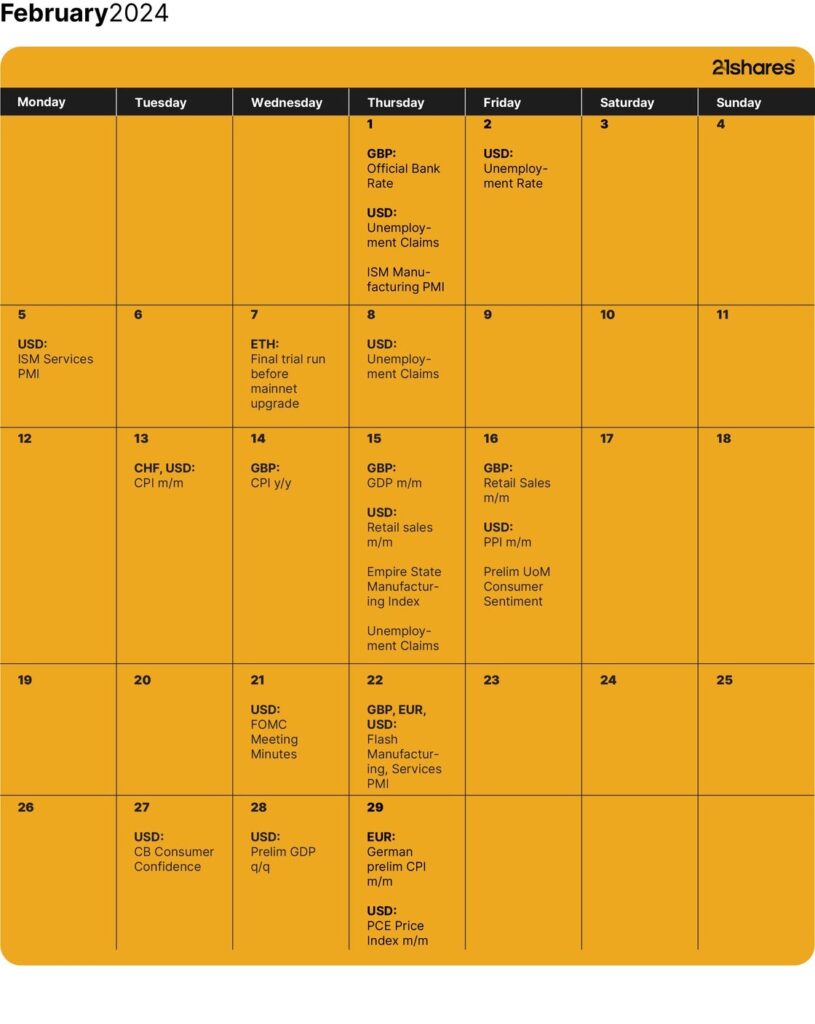
Source: 21Shares, Forex Factory

Research Newsletter

Each week the 21Shares Research team will publish our data-driven insights into the crypto asset world through this newsletter. Please direct any comments, questions, and words of feedback to research@21shares.com

Disclaimer

The information provided does not constitute a prospectus or other offering material and does not contain or constitute an offer to sell or a solicitation of any offer to buy securities in any jurisdiction. Some of the information published herein may contain forward-looking statements. Readers are cautioned that any such forward-looking statements are not guarantees of future performance and involve risks and uncertainties and that actual results may differ materially from those in the forward-looking statements as a result of various factors. The information contained herein may not be considered as economic, legal, tax or other advice and users are cautioned to base investment decisions or other decisions solely on the content hereof.

Nyheter

The Investment Case for TLT (Long-Dated Treasury Bonds)

Publicerad

den

The iShares 20+ Year Treasury Bond ETF (TLT) holds US government bonds that mature in 20 years or more. Since peaking in March 2020 at $179.90 per share, TLT’s price is still down roughly 50%. Most of that drop happened as US inflation – and then interest rates – rose to multi-decade highs. But with inflation now below 3%, potential interest rate cuts ahead, and an interesting chart setup, the investment case for TLT could be building.

The iShares 20+ Year Treasury Bond ETF (TLT) holds US government bonds that mature in 20 years or more. Since peaking in March 2020 at $179.90 per share, TLT’s price is still down roughly 50%. Most of that drop happened as US inflation – and then interest rates – rose to multi-decade highs. But with inflation now below 3%, potential interest rate cuts ahead, and an interesting chart setup, the investment case for TLT could be building.

What is TLT?

The iShares 20+ Year Treasury Bond ETF (TLT) is an exchange-traded fund (ETF) that trades on the US stock market. The fund holds “long-dated” US government bonds with maturities of 20 years or more. By holding a basket of them, TLT reflects how investors generally value this part of the bond market.

Each bond in TLT is a 20-plus year loan to the US government. The investor lends money, and in return receives fixed interest payments (coupons) each year. The government sets the coupon rate when it issues (creates) a new bond, and that rate never changes. After issuance, the bond can trade on the bond market, where its price may move up or down.

What affects the value of long-dated US Treasury bonds (and TLT)?

All else being equal, long-dated Treasury bonds tend to be more volatile than shorter-dated ones. Interest rates and inflation expectations are the two main levers that can move their prices – and hence the price of TLT.

Interest rates: When rates rise, newly issued bonds pay higher coupons. Older bonds in TLT can then look relatively less attractive, so their prices may fall. When rates fall, it’s the opposite: new bonds pay lower coupons, so older bonds look “better” and may rise in price. Because TLT only holds long-dated bonds, its price tends to react more to interest rate changes than short-term bond funds. Rate shifts tend to have a bigger impact on long-dated bonds because their fixed coupons extend far into the future. Even a small change in yields can make those older coupons look much better – or much worse – for a very long time.

Inflation expectations: When investors expect higher inflation in the future, the fixed coupons (and principal) in TLT can look less valuable in today’s money. That perception can push bond prices down as investors sell bonds. And when investors think future inflation will be lower, the same coupons can look more valuable today, which may support bond prices. Because TLT’s bonds mature further into the future, inflation has more time to erode their interest and principal repayments. That’s why long-dated bonds are usually more sensitive to inflation than shorter-dated ones.

The chart below compares the price of TLT (orange) with US interest rates (black) and US inflation (blue). It’s not an exact science, but TLT has tended to move opposite to both of them since the ETF launched in 2003.

Other factors can also play a role. The US government regularly issues (creates) new bonds, and if supply goes up, prices can fall. On the demand side, big buyers like pension funds, insurance companies, or foreign central banks can move the market. Credit risk perception is also key. Investors usually see Treasuries as very low risk, but not “risk-free”. So if they lose confidence in the US government’s repayment ability, it could hurt bond prices.

The investment case for TLT today

We’ve explained how lower interest rates and lower inflation might be a better environment for long-dated US treasury bonds. As explained below, there are reasons to believe we could be moving into that environment now.

The US Federal Reserve (Fed) essentially has two jobs, and it’s a constant balancing act between the two:

  1. Keep inflation down (by raising interest rates to slow the economy).
  2. Keep employment high (by lowering interest rates to speed up the economy).

US inflation peaked above 9% in June 2022, and it’s been trending lower ever since. Inflation isn’t very low yet (2.9% CPI as of August) – but it’s low enough for the Fed to focus more on job number two. Factor in a slowing economy, and the Fed is more likely to cut interest rates from here to boost employment numbers.

The chart below shows the US unemployment rate in orange. It’s now at 4.3% (August) – the highest unemployment rate since November 2021. In the past, unemployment rose gradually at first, before eventually breaking much higher. If that pattern repeats, we could see a bigger spike in unemployment.

Not only is the unemployment rate rising, but the number of new job openings is dropping, too. US nonfarm payrolls (new jobs excluding farming, private households, non-profits, and the military) showed that the US economy added just 22,000 new jobs in August.

And to make matters worse, the government also revised its earlier estimates down. The adjustment meant the US added around 911,000 fewer jobs in the year through March 2025 than first reported.

AI could also factor into these numbers. After all, companies are rolling out AI tech to improve productivity – and that puts pressure on the “human” job market. AI can also make goods and services cheaper to produce, which is inherently disinflationary (the opposite of inflation).

This setup could give the Fed more ammo for bigger rate cuts in the future. Throw in lower inflation, and we could see a solid backdrop for TLT.

The technical picture for TLT

Not many assets are trading near 20-year lows. But as the chart below shows, TLT is trading near technical “support” from the early 2000s (orange). Also note that TLT recently broke above a downward sloping trendline that’s been in play since December 2021. This may signal that selling pressure is easing, and buyers are stepping in.

The chart below shows Bollinger Bands around TLT’s price. Here, the middle band is TLT’s 20-month average price, and each red or green candle represents one month of price movement for TLT.

The further the outer bands are from the middle band, the more volatile TLT’s price, according to the indicator. At this point, the Bollinger Bands are pinching together – a sign of relatively low volatility for TLT. Volatility tends to be “mean reverting” – meaning it usually cycles from periods of lower volatility to higher volatility. If the bands now start to widen, and the price trends higher, we could see a sustained rally for TLT.

The next chart zooms into the weekly timeframe, where each red or green candle represents one week of price movement for TLT. In this case, the Bollinger band width represents the volatility of TLT around its 20-week moving average. The blue line underneath it shows the width of the Bollinger Bands – lower is narrower, and less volatility.

Last month, the Bollinger Bands reached their narrowest level since September 2018. In other words, TLT’s volatility reached its lowest level in seven years, according to the indicator. Now notice how the bands started expanding this month – from that very low volatility base. This suggests TLT could see more volatility going into the end of 2025. Keep in mind that volatility is direction neutral.

Risks

The investment case for TLT depends heavily on inflation staying low and the Fed being willing to cut rates. If inflation rises again, TLT may fall further. Heavy government borrowing could also pressure Treasuries if investors demand more compensation to buy the debt. And if the economy holds up better than expected, the Fed might not need to cut rates.

How IncomeShares ties in

The IncomeShares 20+ Year Treasury Options ETP holds TLT and sells call options on it.

• Selling calls generates option premiums that aim to provide monthly income.

• Exposure to TLT keeps the ETP linked to bond price moves.

• If TLT rises too far, gains may be capped to the strike price.

• If TLT falls, the option income may help cushion part of the drop.

Key takeaways

• TLT holds US government bonds due in 20+ years, which are typically more sensitive to interest rates than short-term bonds.

• After years of losses, inflation is lower, yields are higher, and economic data points to a slowdown – but risks remain.

• The IncomeShares TLT Options ETP aims to generate monthly income by selling calls, while keeping some exposure to TLT.

Follow IncomeShares EU for more insights.

Your capital is at risk if you invest. You could lose all your investment. Please see the full risk warning here.

Fortsätt läsa

Nyheter

AFET ETP erbjuder investerare exponering mot världens största decentraliserade AI-ekosystem

Publicerad

den

21Shares Artificial Superintelligence Alliance ETP (AFET ETP) med ISIN CH1480821375, ger investerare likvid exponering mot ett unikt decentraliserat AI-ekosystem som skapats genom sammanslagningen av Fetch.ai, SingularityNET, Ocean Protocol och CUDOS, en sammanslagning av fyra banbrytande projekt som bildar den största AI-alliansen med öppen källkod som är dedikerad till att påskynda vägen mot artificiell generell intelligens och superintelligens.

21Shares Artificial Superintelligence Alliance ETP (AFET ETP) med ISIN CH1480821375, ger investerare likvid exponering mot ett unikt decentraliserat AI-ekosystem som skapats genom sammanslagningen av Fetch.ai, SingularityNET, Ocean Protocol och CUDOS, en sammanslagning av fyra banbrytande projekt som bildar den största AI-alliansen med öppen källkod som är dedikerad till att påskynda vägen mot artificiell generell intelligens och superintelligens.

Fördelar

Decentralisering av datorkraft

Artificial Superintelligence Alliance (ASI) har säkrat över 200 miljoner dollar i dedikerad AI-datorinfrastruktur, vilket skapar världens största decentraliserade AI-datornätverk. Detta djärva initiativ syftar till att utmana teknikjättarnas dominans och bryta de centraliserade AI-grindvakternas grepp.

Genom att kombinera datacenter i företagsklass med resurser som bidrar med gemenskapen levererar ASI premium GPU-prestanda till upp till 50 % lägre kostnad än ledande molnleverantörer. Med 524 valideringsnoder och globalt distribuerad kapacitet säkerställer ASI låg latens och tillförlitlighet.

Denna metod vänder upp och ner på traditionell molnekonomi: allt eftersom nätverket växer minskar kostnaderna för utvecklare medan prestandan förbättras. Med den globala molnmarknaden som överstiger 500 miljarder dollar och AI-arbetsbelastningar som växer snabbt är ASI redo att ta betydande marknadsandelar genom att erbjuda ett mer kostnadseffektivt, högpresterande och öppet alternativ till dagens centraliserade modell.

Nästa generations AI-ekosystem

ASI Alliance har framgångsrikt genomfört en betydande tokenintegration genom att förena Fetch.ai, SingularityNET, Ocean Protocol och CUDOS för att skapa ett av de största decentraliserade AI-ekosystemen i branschen.
Denna sammanslagning skapar en oöverträffad nytta för FET-tokeninnehavare, som omfattar autonoma agenter, utveckling av artificiell generell intelligens (AGI), datamarknadsplatser och distribuerad databehandling. Den demonstrerar också sin innovationskraft med ASI 1 Mini, den första Web3-inbyggda stora språkmodellen. ASI 1 Mini körs effektivt på minimal hårdvara, stöder modulärt resonemang och autonoma arbetsflöden och integreras sömlöst i ASI-ekosystemet, vilket gör det möjligt för communityn att staka, träna och deläga modellen.

Genom att kombinera effektivitet, tillgänglighet och decentraliserat ägande bygger ASI Alliance inte bara AI-infrastruktur; den omformar intelligensens ekonomi. Positionerad i skärningspunkten mellan Web3 och AI, är ASI redo att bli en transformerande kraft med massiv potential för tillväxt och påverkan.

Infrastruktur för intelligensens era

ASI Alliance bygger ASI Chain, den första Layer 1-blockkedjan som är uttryckligen utformad för decentraliserad AI-koordinering, autonoma agenter och interoperabilitet mellan kedjor. Till skillnad från traditionella molnleverantörer som introducerar systemrisker eller äldre blockkedjor byggda för enkla tillgångsöverföringar, är ASI Chain specialbyggd för AI-drivna arbetsbelastningar, med en skalbar arkitektur, säkerhet i företagsklass och ett dataflödesmål på över 1 000 transaktioner per sekund. Kärnan är ASI 1 Mini, som möjliggör intelligens på kedjan som ingen annan Layer 1 för närvarande erbjuder.

Lager 1-blockkedjor är hörnstenen i branschens framtid, med en marknad som redan värderas till över 1,2 biljoner dollar. Ledande nätverk har en genomsnittlig värdering på 45 miljarder dollar, vilket belyser det enorma gapet till ASIs nuvarande värdering på 1,7 miljarder dollar. Detta positionerar ASI för att framstå som det definierande Layer 1 i AI-eran och överbrygga blockkedjeinfrastruktur med intelligensens ekonomi.

Eftersom integrationen av AI och blockkedja förväntas nå 350 miljarder dollar år 2030, är ASI Chain perfekt positionerad för att dra nytta av denna tillväxt. Med stora företagspartners som Deutsche Telekom, Bosch och Alibaba Cloud som stödjer valideringsinfrastrukturen, är ASI Chain redo att accelerera AI-implementeringen inom olika branscher, vilket ger investerare en enorm tillväxtpotential.

Produktinformation

Namn21Shares Artificial Superintelligence Alliance ETP
Lanseringsdatum16 september 2025
Emittent21Shares AG
Förvaltningsavgift2,50 procent
UtlåningNej
KortnamnAFET
Valor148082137
ISINCH1480821375
ReutersAFET.S
WKNA4APVJ
BloombergAFET SW
Underliggande tillgångar100 procent Artificial Superintelligence Alliance

Handla AFET ETP

21Shares Artificial Superintelligence Alliance ETP (AFET ETP) är en europeisk börshandlad fond som handlas på bland annat Euronext Amsterdam.

Euronext Amsterdam är en marknad som få svenska banker och nätmäklare erbjuder access till, men DEGIRO gör det.

Börsnoteringar

BörsValutaKortnamn
Euronext AmsterdamUSDAFET NA
Euronext ParisEURAFET FP

Fortsätt läsa

Nyheter

ONCE ETP spårar den schweiziska dagslåneräntan och hedgas i euro

Publicerad

den

Leonteq CHF Overnight Return Index (EUR) ETP (ONCE ETP), med ISIN CH1390861222, försöker följa Leonteq CHF Overnight Return (EUR Hedged) index. Leonteq CHF Overnight Return (EUR Hedged)-index följer den schweiziska penningmarknaden och ger en avkastning på 1/360 av referensräntan Swiss Average Rate Overnight Zinssatz (SARON) per kalenderdag. Valutasäkrad till euro (EUR).

Leonteq CHF Overnight Return Index (EUR) ETP (ONCE ETP), med ISIN CH1390861222, försöker följa Leonteq CHF Overnight Return (EUR Hedged) index. Leonteq CHF Overnight Return (EUR Hedged)-index följer den schweiziska penningmarknaden och ger en avkastning på 1/360 av referensräntan Swiss Average Rate Overnight Zinssatz (SARON) per kalenderdag. Valutasäkrad till euro (EUR).

Certifikatets TER (total cost ratio) uppgår till 0,10 % p.a. Leonteq CHF Overnight Return Index (EUR) ETP är det enda ETN som följer Leonteq CHF Overnight Return (EUR Hedged) index. Denna ETN replikerar det underliggande indexets prestanda syntetiskt med en swap.

Denna ETN lanserades den 4 november 2024 och har sitt säte i Schweiz.

Indexmål

Leonteq CHF Overnight Return Index ger syntetisk exponering mot Swiss Average Rate Overnight (”SARON”).

Beskrivning

Indexet syftar till att spåra rörelserna i SARON-räntan, som det breda måttet på kostnaden för att låna schweiziska francs kontanter över natten.

Handla ONCE ETP

Leonteq CHF Overnight Return Index (EUR) ETP (ONCE ETP) är en europeisk börshandlad fond. Denna fond handlas på Deutsche Boerse Xetra.

Det betyder att det går att handla andelar i denna ETF genom de flesta svenska banker och Internetmäklare, till exempel DEGIRONordnet, Aktieinvest och Avanza.

Börsnoteringar

BörsValutaKortnamn
XETRAEURONCE

Fortsätt läsa

21Shares

Prenumerera på nyheter om ETFer

* indicates required

21Shares

21Shares

Populära