Gold Price and U.S. Dollar Head in Opposite Directions Van Eck Global’s gold specialist Joe Foster shares his monthly perspective on the gold market.
» Open Gold Market Commentary
Gold Price and U.S. Dollar Head in Opposite Directions
Gold Market Commentary
By: Joe Foster, Gold Strategist
Market Review
After falling to its cycle lows in July, the gold price had advanced nicely and last month we wondered whether the positive trend was sustainable. The short answer is: No, it wasn’t. In November, the gold price fell to new 5.5-year lows at $1,052 per ounce, as the U.S. Dollar Index1 (DXY) approached long-term highs. Gold ended the month at $1,064.77 per ounce for a loss of $77.39 (6.8%).
On November 4, Bloomberg News reported that Federal Reserve (the “Fed”) Chair Janet Yellen said an improving economy would set the stage for a December interest rate increase if economic reports continue to assure policymakers that inflation will accelerate over time. This set the tone for both gold and the U.S. dollar, which fell and rose, respectively, for the remainder of the month. A strong jobs report on November 6, followed by generally positive economic releases throughout the month enabled market consensus to gain momentum for a rate increase at the December 16 Federal Open Market Committee (FOMC) meeting. Gold bullion exchange-traded products (ETPs) saw 1.59 million ounces (49.3 tonnes) of redemptions in November which drove gold ETPs’ combined holdings to a new cycle low of 47.92 million ounces (1,490.3 tonnes).
During November gold equity indices fell with the gold price and nearly met the lows set in July. The NYSE Arca Gold Miners Index2 (GDMNTR) declined 8.5%, while the Market Vectors Junior Gold Miners Index3 (MVGDXJTR) fell 8.6%. Low gold prices caused investors to largely ignore the robust results of the third quarter earnings season. BMO Capital Markets reported free cash flow of $978 million from the North American senior miners, far surpassing expectations of $94 million. Scotiabank’s universe of senior and larger mid-caps had production that was 3% above expectations and all-in mining costs that were 8% lower than expected. The favorable results stemmed from operating efficiency, bear market pricing for materials and services, low local currency values, and low fuel prices. Many companies have indicated that there is still room to cut costs further. We now expect positive production results and cost-savings to continue in 2016.
Physical demand for gold bars, coins, and jewelry improved in the third quarter. The World Gold Council (WGC) reported that Q3 gold demand increased by 8% over Q2 and by 14% over last year. Year-to-date demand is up 3% versus the same period in 2014. The WGC reckons that there was a gold market deficit of 56.0 tonnes in Q3. The largest drivers of this strong demand were India and China, where demand increased 13% in each country which equates to a 58.0 tonne increase over Q2. Chinese demand continues as physical deliveries from the Shanghai Gold Exchange through November have now surpassed the record set in 2013.
Investors might wonder how gold can make new lows in July and again in November while the market has been in a deficit, which means demand is presumably outstripping supply. The gold market is unique among commodities and indeed unique in the financial world. Most gold is hoarded as a financial asset, like currencies, stocks, and bonds. It is not consumed like oil, copper, or soybeans. All of the gold ever produced is sitting in a vault, safe, jewelry box, place of worship, or museum, or is adorning a person’s body. This gold represents a huge reservoir of potential supply, some of which is available at a price. This is why the supply/demand drivers that apply to most commodities may not apply to gold. In addition, the gold market is not sufficiently transparent to account for all of the transactions that occur globally. All of the gold that the WGC can account for amounted to a 56.0 tonne deficit in Q3, however, there is gold the WGC cannot count that may make this deficit larger or perhaps nonexistent altogether.
For commodities other than gold, strong physical demand drives prices higher – prices follow demand. With gold, the current price drives physical demand – demand follows prices. Lower prices entice buyers in India and China. They also bring strong retail demand from the U.S. and Europe. This physical demand increases when prices drop, helping to stabilize prices. However, physical demand usually diminishes when prices increase.
Investment demand generates price strength in the gold market and a lack of investment demand characterizes bear markets. The motives that drive both physical and investment demand are the same – to utilize gold as a store of wealth and a hedge against currency weakness, tail risk4, or financial stress. However, investment demand manifests itself mainly in the futures market in New York and the over-the-counter market in London. These markets exert the largest influence on gold prices and they are driven more by macroeconomic, financial, and geopolitical events than by prices and supply/demand equations.
Gold ETPs are relatively transparent vehicles that we use as a proxy for broad investment demand. In Q3 global bullion ETPs had 63.0 tonnes of redemptions. This is probably a good indicator of weak investment demand in New York and London. It also lends better insight into price action than physical demand from China or elsewhere.
We believe that physical demand should play a larger role in price discovery, and maybe it eventually will as the Asian gold market grows and matures. In the meantime, the Chinese seem happy to accumulate all the gold the West cares to provide at low gold prices. Regardless of what we believe should happen, we make investment decisions based on what actually drives the market. This means investing in companies that can survive intact or gain an advantage if a lack of investment demand drives prices lower than expected.
Market Outlook
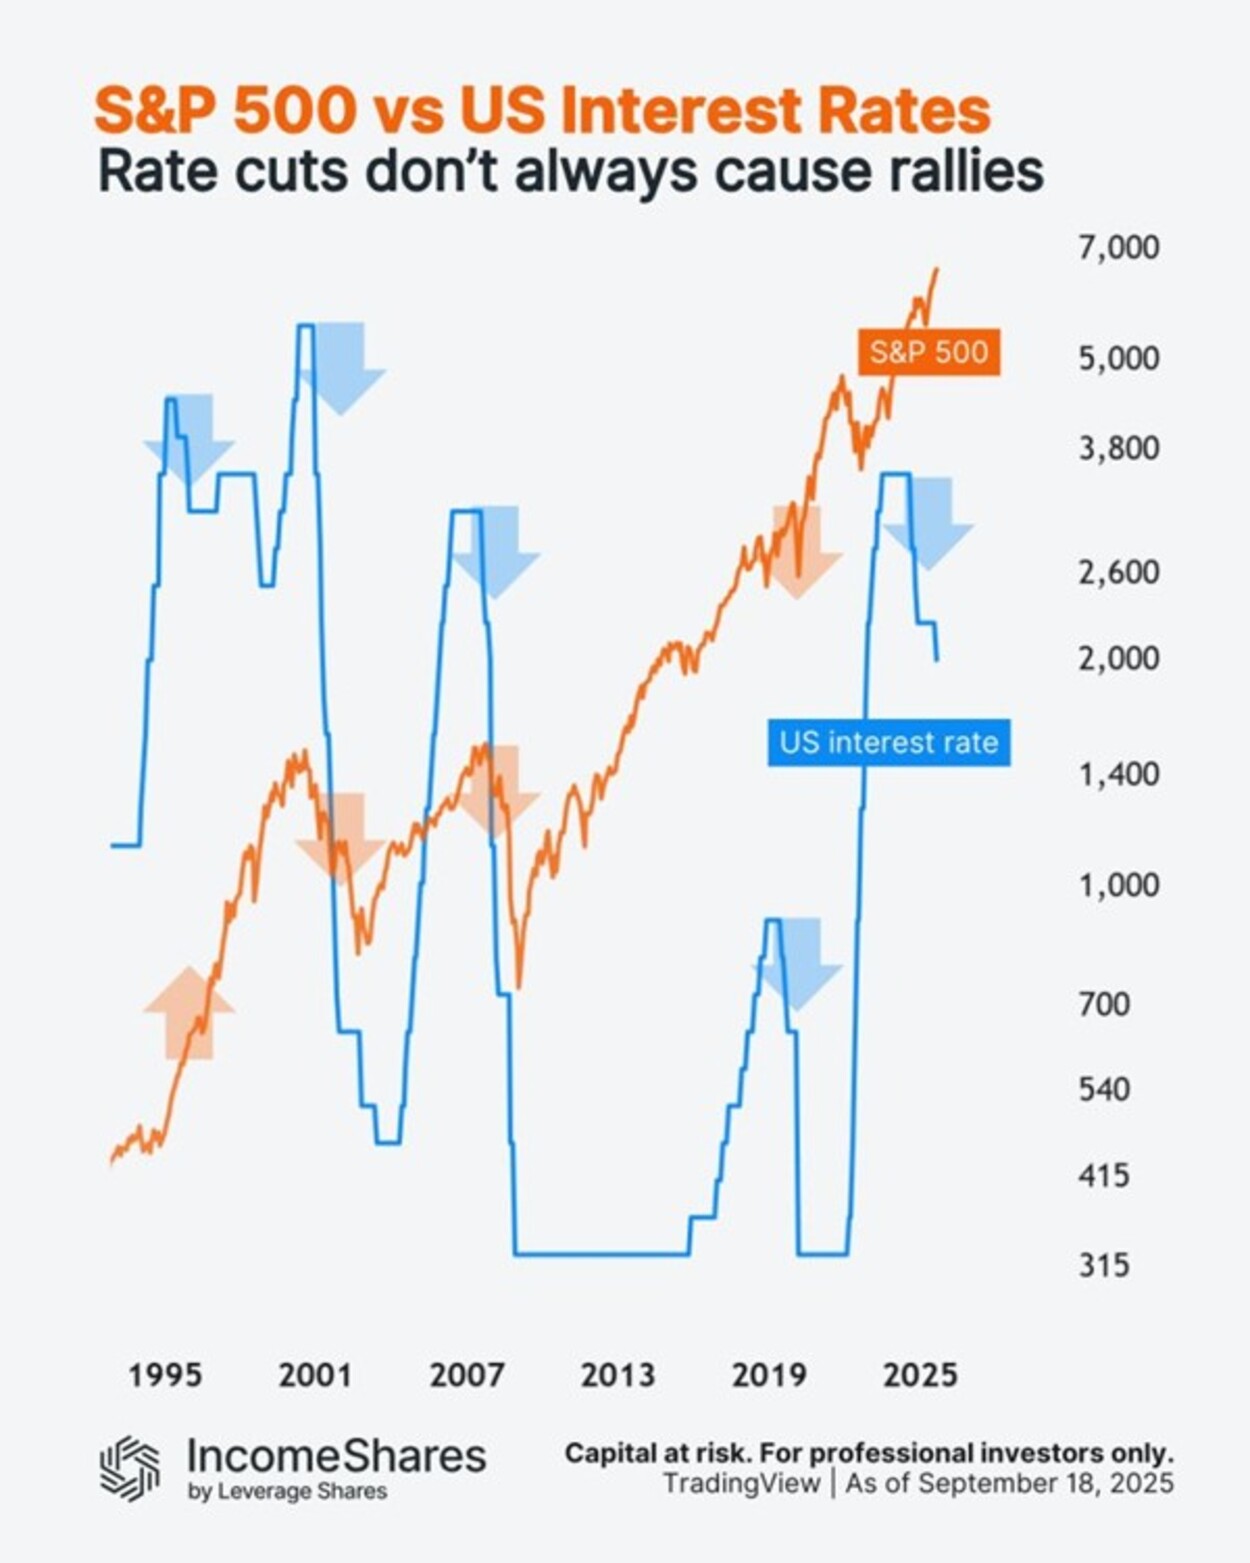
Once again the markets are essentially convinced that the Fed will raise rates at the next FOMC meeting. Based on recent Fed comments, economic releases, and the level of expectations, we will be shocked if the Fed doesn’t raise rates. Rate rising cycles introduce risks to the economy and financial system and they often end badly. According to Gluskin Sheff5, a bull market in the S&P 500 Index6 has never ended after an initial rate hike. It is a different story if the rate hikes keep coming. The stock market crashed in October 1987 after three rate hikes over five months. NASDAQ crashed in April 2000 after six rate hikes over 11 months. Rate increases are often a prelude to recessions, which become increasingly likely as the yield curve flattens or inverts (when short-term rates exceed long-term rates).
The Fed has never waited as long as five years into a bull market to begin to raise rates. A few reasons the Fed has been reluctant to pull the trigger:
■ In the last four decades, the Fed has never raised rates when the Institute of Supply Management (ISM) Manufacturing Index7 was below 50, which signifies a manufacturing recession. The ISM Index is currently 48.6.
■ How long can Fed policies diverge from the rest of the world where the central banks of Europe, China, Australia, and Japan are all easing to combat economic weakness?
■ Every country that started a rate-hiking course after the Great Recession that ended in 2009 was ultimately forced to reverse course.
On November 2 as we watched Fed Chair Yellen address the Economic Club of Washington D.C., the U.S. Dollar Index approached a 12.5-year high while gold made a new 5.5-year low at $1,052 per ounce. With the U.S. dollar and gold at extreme levels, it seems the market has already priced in forthcoming rate hikes. Credit Suisse reported in October that historically when the U.S. has raised rates the dollar has stopped appreciating. In some cases the dollar fell into a bear market and in others the dollar eventually recovered.
Gold has a similarly inconsistent reaction to rate increases, as shown in this excerpt from our March gold market update, written when the market was obsessed with the Fed’s rate decision, as it unfortunately still is:
Scotiabank has analyzed the last six tightening cycles since 1982 when a suitable gold index became available. They found that gold prices advanced in the year following the first rate increase in half of the cycles, whereas gold declined in the other half. Scotia points out that the only other point at which the Fed raised rates in a low-inflation environment was in 1986, when rates were increased in order to help defend a sharply depreciating U.S. dollar. It was also one of the rate-rising periods when gold performed well. The Scotia analysis leads to an uncertain outlook; it tells us that sometimes gold advances when rates rise and sometimes it does not. However, the economic and financial backdrop to the next rate cycle is unlike any other in history. The imbalances in asset markets, sovereign debt levels, and central bank finances create risks that may become overwhelming under the stress of rising rates. Perhaps the first rate increase will mark the beginning of the end of the gold bear market.
by Joe Foster, Portfolio Manager/Strategist
With more than 30 years of gold industry experience, Foster began his gold career as a boots on the ground geologist, evaluating mining exploration and development projects. Foster offers a unique perspective on gold and the precious metals asset class.
Important Information For Foreign Investors
This document does not constitute an offering or invitation to invest or acquire financial instruments. The use of this material is for general information purposes.
Please note that Van Eck Securities Corporation offers actively managed and passively managed investment products that invest in the asset class(es) included in this material. Gold investments can be significantly affected by international economic, monetary and political developments. Gold equities may decline in value due to developments specific to the gold industry, and are subject to interest rate risk and market risk. Investments in foreign securities involve risks related to adverse political and economic developments unique to a country or a region, currency fluctuations or controls, and the possibility of arbitrary action by foreign governments, including the takeover of property without adequate compensation or imposition of prohibitive taxation.
Please note that Joe Foster is the Portfolio Manager of an actively managed gold strategy.
Any indices listed are unmanaged indices and include the reinvestment of all dividends, but do not reflect the payment of transaction costs, advisory fees or expenses that are associated with an investment in the Fund. An index’s performance is not illustrative of the Fund’s performance. Indices are not securities in which investments can be made.
1NYSE Arca Gold Miners Index (GDMNTR) is a modified market capitalization-weighted index comprised of publicly traded companies involved primarily in the mining for gold. 2Market Vectors Junior Gold Miners Index (MVGDXJTR) is a rules-based, modified market capitalization-weighted, float-adjusted index comprised of a global universe of publicly traded small- and medium-capitalization companies that generate at least 50% of their revenues from gold and/or silver mining, hold real property that has the potential to produce at least 50% of the company’s revenue from gold or silver mining when developed, or primarily invest in gold or silver. 3Tail risk is the risk of an asset or portfolio of assets moving more than three standard deviations from its current price. 4S&P 500® Index (S&P 500) consists of 500 widely held common stocks covering industrial, utility, financial, and transportation sectors. 5Dot-com bubble grew out of a combination of the presence of speculative or fad-based investing, the abundance of venture capital funding for startups and the failure of dotcoms to turn a profit. Investors poured money into internet startups during the 1990s in the hope that those companies would one day become profitable, and many investors and venture capitalists abandoned a cautious approach for fear of not being able to cash in on the growing use of the internet. 6Source: Bloomberg.
Please note that the information herein represents the opinion of the author and these opinions may change at any time and from time to time. Not intended to be a forecast of future events, a guarantee of future results or investment advice. Historical performance is not indicative of future results; current data may differ from data quoted. Current market conditions may not continue. Non-Van Eck Global proprietary information contained herein has been obtained from sources believed to be reliable, but not guaranteed. No part of this material may be reproduced in any form, or referred to in any other publication, without express written permission of Van Eck Global. ©2015 Van Eck Global.


 Nyheter4 veckor sedan
 Nyheter2 veckor sedan
 Nyheter4 veckor sedan