
Nyheter
Europe Passes MiCA, MakerDAO Strengthens Reserves, and More!
Bitcoin and Ethereum are down by 3% and 3.6%, respectively, over the past week. In this regard, Bitcoin dropped the least out of all the major Layer 1 protocols, as shown in Figure 1. On another front, Metis and MakerDAO outperformed in the Layer 2 and decentralized finance landscapes, respectively. MakerDAO appreciated 16.3%, while Metis had a 20% increase in TVL on the back of a 26-week-long builder incentive program.
Figure 1: TVL and price development of major crypto sectors
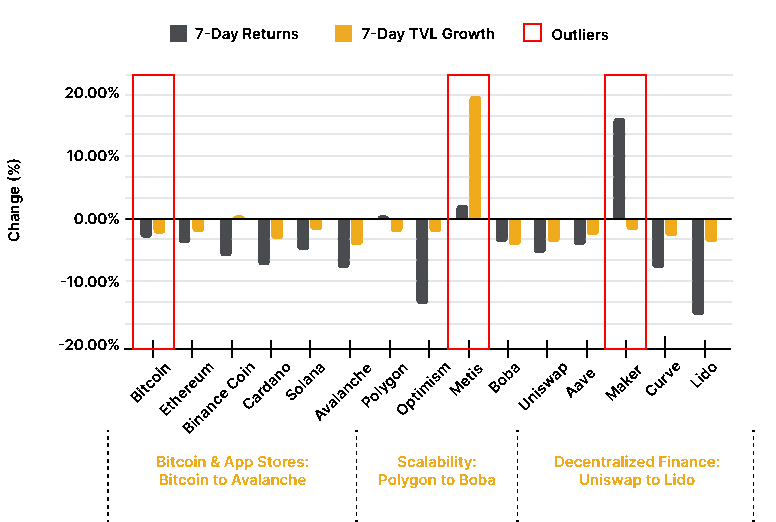
Source: 21Shares, Coingecko, DeFi Llama
Key takeaways
• Europe passes landmark crypto regulation for a final vote.
• $560M stolen as BNB Smart Chain gets hacked in yet another bridge exploit.
• MakerDAO is allocating $500M of its balance sheet to short-term US Treasuries and corporate bonds.
• US Trademark applications for NFTs and Web3 tools have doubled year over year.
Spot and Derivatives Markets
Figure 2: Perpetual Futures Open Interest on Binance
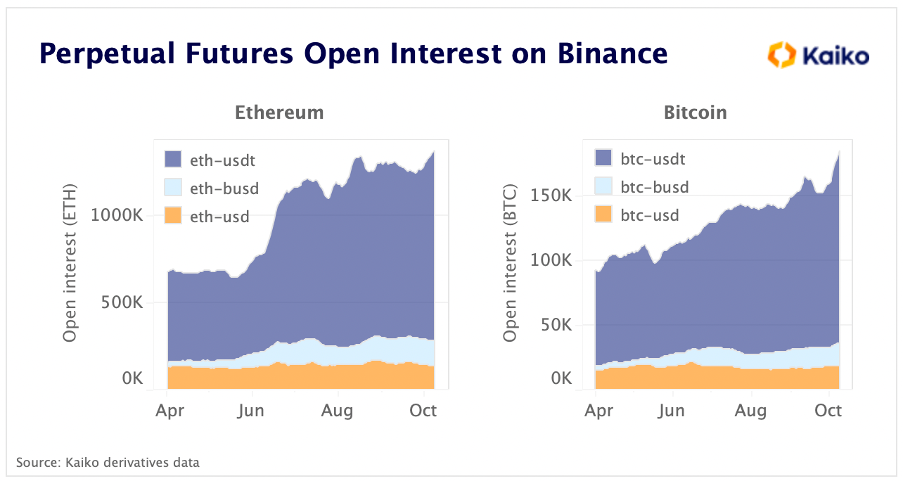
Source: Kaiko
Bitcoin and Ethereum open interest on Binance, the world’s largest crypto exchange, rose to all-time highs. As per Kaiko, BTC’s open interest measured in native units surged by around 20% since the end of September to 183K BTC. Over the same time frame, ETH’s open interest rose by 10% to 1.3 million ETH. As a reminder, open interest refers to the total number of outstanding derivative contracts that have not been settled. The increase in open interest suggests that new money is coming into the market despite the macroeconomic uncertainty.
In addition, we can observe that BUSD-denominated instruments have gained traction due to Binance’s decision to automatically convert USDC to their native stablecoin (BUSD) to enhance users’ liquidity and capital efficiency.
On-chain Indicators
Figure 3: Bitcoin’s NUPL ratio
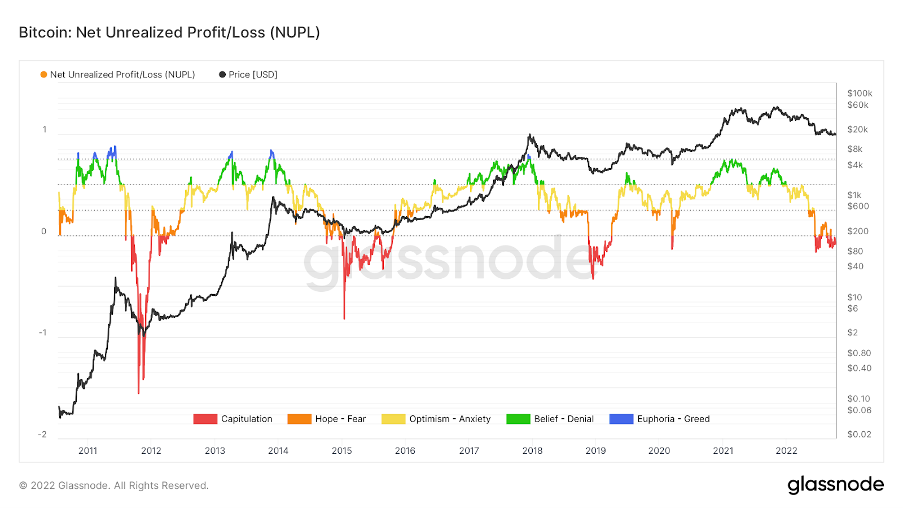
Source: Glassnode
The NUPL ratio, which we have featured in past newsletters, measures the P&L of BTC investors — ranging from 1 to negative numbers. This metric has been instrumental in evaluating investor sentiment and identifying the tops and bottoms for the price of BTC over the past decade. Depending on whether we are in a bull market or a bear market, the level of the NUPL ratio categorizes investor sentiment in 5 brackets, as you can see in Figure 3. NUPL is back in the capitulation zone after slightly recovering in July-August.
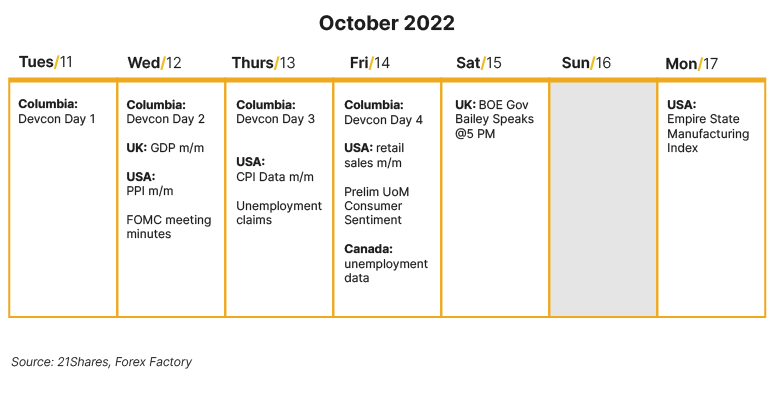
Next Week’s Calendar
Read full report here
Research Newsletter
Each week the 21Shares Research team will publish our data-driven insights into the crypto asset world through this newsletter. Please direct any comments, questions, and words of feedback to research@21shares.com
Disclaimer
The information provided does not constitute a prospectus or other offering material and does not contain or constitute an offer to sell or a solicitation of any offer to buy securities in any jurisdiction. Some of the information published herein may contain forward-looking statements. Readers are cautioned that any such forward-looking statements are not guarantees of future performance and involve risks and uncertainties and that actual results may differ materially from those in the forward-looking statements as a result of various factors. The information contained herein may not be considered as economic, legal, tax or other advice and users are cautioned to base investment decisions or other decisions solely on the content hereof.


Even buying Bitcoin at its yearly peak since 2020 would still have doubled your investment, proving the power of long-term growth versus trying to time the market.


Why Solana matters: Exploring its use cases and growing adoption
Solana’s surge isn’t just market speculation; it’s driven by real-world adoption. From payments and DeFi to tokenization, the blockchain is seeing record engagement, reflected in its all-time high total value locked (TVL).


How Raydium and Jupiter are powering Solana DeFi
Raydium and Jupiter are the pillars of Solana’s DeFi ecosystem, delivering deep liquidity, seamless trading, and efficient execution that keep the network thriving. They make crypto markets faster, cheaper, and more accessible for everyone.


Research Newsletter
Each week the 21Shares Research team will publish our data-driven insights into the crypto asset world through this newsletter. Please direct any comments, questions, and words of feedback to research@21shares.com
Disclaimer
The information provided does not constitute a prospectus or other offering material and does not contain or constitute an offer to sell or a solicitation of any offer to buy securities in any jurisdiction. Some of the information published herein may contain forward-looking statements. Readers are cautioned that any such forward-looking statements are not guarantees of future performance and involve risks and uncertainties and that actual results may differ materially from those in the forward-looking statements as a result of various factors. The information contained herein may not be considered as economic, legal, tax or other advice and users are cautioned to base investment decisions or other decisions solely on the content hereof.


Time in Bitcoin beats timing Bitcoin

WMMV ETF en lågvolatilitetsfond som handlas i euro och pund
UBS AM lanserar UBS Treasury Yield Plus ETFer
COINUNI ETP spårar kryptovalutan Uniswap

ETF- och ETP-noteringar den 16 september 2025: nytt på Xetra och Börse Frankfurt

Utdelningar och försvarsfonder lockade i augusti

Månadsutdelande ETFer uppdaterad med IncomeShares produkter

HANetfs analyserar hur ett fredsavtal kan påverka det europeiska försvaret

ADLT ETF investerar bara i riktigt långa amerikanska statsobligationer

Septembers utdelning i XACT Norden Högutdelande
-
 Nyheter3 veckor sedan
Utdelningar och försvarsfonder lockade i augusti
-
 Nyheter4 veckor sedan
Månadsutdelande ETFer uppdaterad med IncomeShares produkter
-
 Nyheter4 veckor sedan
HANetfs analyserar hur ett fredsavtal kan påverka det europeiska försvaret
-
 Nyheter4 veckor sedan
ADLT ETF investerar bara i riktigt långa amerikanska statsobligationer
-
 Nyheter2 veckor sedan
Septembers utdelning i XACT Norden Högutdelande
-

 Nyheter3 veckor sedan
Fastställd utdelning i MONTDIV augusti 2025
-

 Nyheter2 veckor sedan
HANetf kommenterar mötet mellan Kina, Ryssland och Nordkorea vid militärparad
-

 Nyheter4 veckor sedan
AICT ETF investerar i obligationer utgivna av företag från tillväxtmarknader