
Nyheter
Ethereum vs Solana – The iOS vs Android of Crypto
• Solana’s Explosive Growth: Solana has outpaced Ethereum by 100% over the past year, driven by soaring adoption, high-profile partnerships and surging growth of its ecosystem. Its high throughput, and cost efficiency enabled it to process nearly 50% of NASDAQ’s volume and attract millions of active users by January of 2025.
• Ethereum’s Institutional Resilience: While Ethereum has faced challenges, its appeal to Wall Street and growing ETF inflows position it for a resurgence, cementing its role as the leading platform for institutional finance due to its unparalleled security and first-mover advantage.
• Diverging Market Focus: Solana excels in real-world payments and consumer-focused applications, while Ethereum dominates asset tokenization and institutional financial products, reflecting their distinct strengths.
• Sector Leadership Reflects Coexistence: Solana leads in emerging industries like AI agents and DePIN – and brings along with it a host of new developers – while Ethereum retains dominance in DeFi with six times Solana’s total value locked (TVL), showcasing their complementary roles rather than direct competition.
In recent months, Solana has emerged as a leading platform, significantly influencing two of the most popular sectors: memecoins and AI agents. Its relevance in both areas can be attributed to two key factors: cost-effectiveness and superior throughput compared to established blockchains. This prominence was highlighted when President Donald Trump launched his memecoin on Solana just before his inauguration, sparking additional excitement in the memecoin space. Additionally, Virtuals platform, a major launchpad for AI agents initially on the Base network, announced its expansion to Solana. Given these developments, it’s an opportune moment to explore how Solana differentiates itself from Ethereum, examine their respective strengths, and discuss why, despite facing substantial criticism, Ethereum’s future remains promising as the largest smart contract platform by market capitalization.
To begin with, Solana has significantly outperformed Ethereum over the past year, surpassing it by over 100% in performance. Solana’s rise can be credited to its strategic partnerships and expanding ecosystem, but its performance has also benefited from setbacks in Ethereum’s scaling roadmap, which have raised concerns about the latter’s long-term viability.
Figure 1: Ethereum and Solana Performance in Last Year
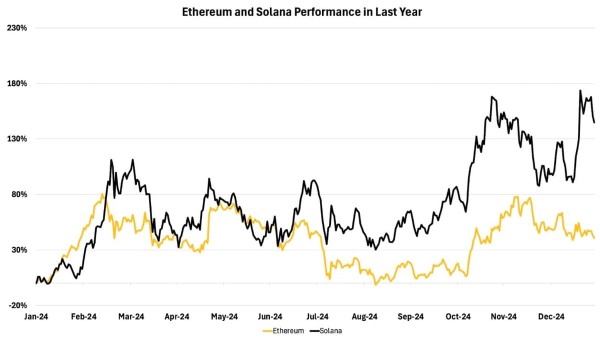
Source: 21Shares, CoinGecko
Technical Performance
It’s important to remember that Ethereum features an additional layer built on top of it that helps it address its scaling limitations, thus the comparison shouldn’t just be between Ethereum and Solana. However, to contextualize, here’s how both settlement layers differ in terms of their technical performance:
Figure 2: Technical Comparison Between Solana and Ethereum
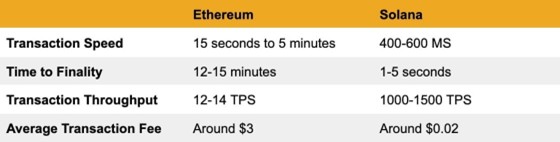
Source: 21Shares, Etherscan, Validator.app, Dune
Usage and Adoption
Ethereum’s technical constraints have hindered its ability to provide a scalable experience comparable to Solana. Consequently, Solana’s Layer 1 architecture has given it a significant advantage not only over Ethereum itself but also over its entire ecosystem of Layer 2 solutions.
Figure 3: Weekly Transactions of Solana versus Ethereum & *L2s
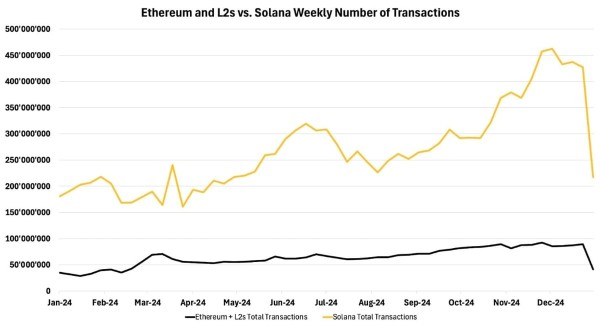
Source: 21Shares, Dune
*L2s include: zkSync, zkEVM, Arbitrum, Optimism, Base, Scroll, Linea, Celo, Zora
The weekly user count paints a similar picture, revealing that Solana also surpasses Ethereum and its L2s in overall activity.
Figure 4: Weekly Active Users of Solana versus Ethereum & L2s*
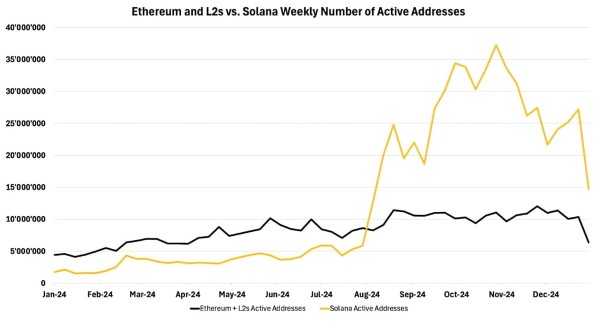
Source: 21Shares, Dune
*L2s include: zkSync, zkEVM, Arbitrum, Optimism, Base, Scroll, Linea, Celo, Zora
Clearly Solana has been experiencing an unprecedented surge in user activity. In the past, Solana experienced significant network outages, which previously halted the blockchain for hours. However, these issues have been largely resolved since the last major incident in February 2024 as seen in Figure 5. While they varied in cause, most of the incidents highlighted a common issue: the need for diverse validator clients beyond the iterations initially developed by the Solana Foundation. To address this, Solana has implemented several solutions, including the development of alternative validator clients such as Jump Crypto’s Firedancer, which we’ll explore in detail later. This diversification strategy aims to bolster network resilience and minimize the risk of system-wide failures.
Figure 5: Total Number of Solana’s Outages over Last Three Years
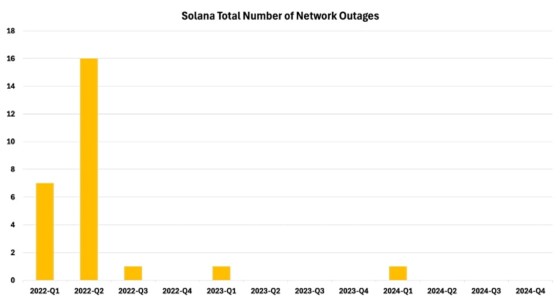
Source: 21Shares, Four Pillars
Value Capture
When it comes to the networks’ economic models, Solana and Ethereum both employ a base fee structure, but with key differences. Ethereum’s base fee fluctuates and is burned, creating a deflationary effect, while Solana’s remains constant at 5000 lamports (0.0005% of one SOL) and isn’t removed from circulation. Further, both networks allow users to pay additional fees for transaction prioritization. Thus, Solana’s scalable architecture results in more predictable and significantly lower fees compared to Ethereum, enhancing user experience for high-frequency transactions.
While fees on Solana remain cheap, Maximal Extractable Value (MEV) has been gaining prominence on the network as liquidity and users have increasingly migrated to the platform, as illustrated in Figure 6. This movement is drawn by its high level of activity and growing ecosystem.
Figure 6: Solana Staking Yield Breakdown
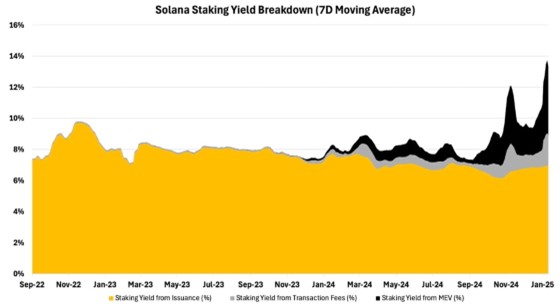
Source: 21Shares, Dune
In contrast, MEV is playing a diminished role in Ethereum’s validator economy, as Figure 7 demonstrates, due to activity shifting to other networks, resulting in fewer lucrative opportunities for validators to capitalize on. This dynamic also means the total yield for stakers has become less attractive, putting even more pressure on the network’s model.
Figure 7: Ethereum Staking Yield Breakdown
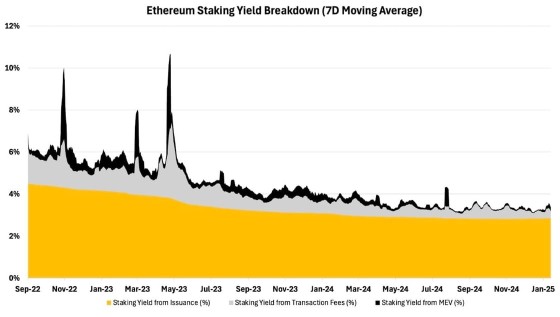
Source: 21Shares, Dune
Ecosystem Analysis
Despite Ethereum’s model coming under scrutiny, its ecosystem still dwarfs Solana’s, with nearly 6x the Total Value Locked (TVL). In fact, Ethereum boasts the largest Decentralized Finance (DeFi) ecosystem, with liquid staking and restaking dominating and accounting for more than half the total capital deployed into the network. Further, money market protocols like Aave and Maker follow with 38% of the market share. Finally, Ethereum also leads in stablecoins, controlling about 55% of the $215B market. Solana’s ecosystem mirrors this structure. However, DEXs and lending dominate the ecosystem with around 50% in market share, followed by liquid staking dominating almost 47% of the ecosystem’s TVL. Despite Solana’s impressive growth, its TVL remains considerably lower than Ethereum’s. However, this disparity presents a substantial opportunity for Solana, as the increasing enthusiasm surrounding its ecosystem could potentially fuel significant future expansion.
Liquid Staking
Zooming in, liquid staking dominates revenue generation on both Ethereum and Solana. Lido Finance, Ethereum’s leading non-custodial staking provider since 2020, generated $1.04B in the past year. Similarly, Jito Finance, Solana’s counterpart, nearly matched this with $904M in revenue, as illustrated in Figure 8. These figures underscore the significant role of liquid staking in the financial ecosystems of both networks.
Figure 8: Applications Revenue
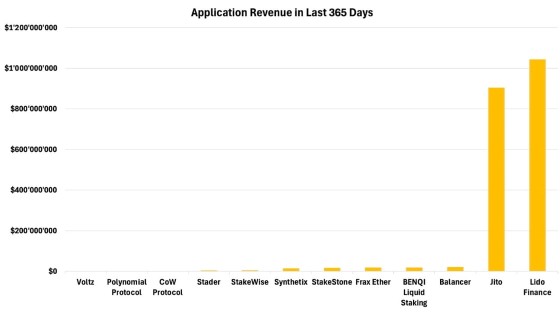
Source: 21Shares, TokenTerminal
Regarding Jito, its remarkable financial success can be attributed to its innovative MEV infrastructure on Solana, which maximizes user yield without relying on external providers and has been adopted by over 90% of the network validators. This achievement coincided with the explosive growth of the Solana ecosystem, driven by memecoin speculation and emerging AI trends, which amplified MEV opportunities for validators. As a result, Solana’s liquid staking market experienced a lot more growth, expanding by nearly 6% over the past 12 months, as illustrated in Figure 9, versus Ethereum, which has plateaued at around 44% over the same period. This combination of technological innovation and market dynamics has positioned Jito at the forefront of Solana’s burgeoning DeFi landscape.
Figure 9: Ethereum vs Solana Liquid Staking Ratio
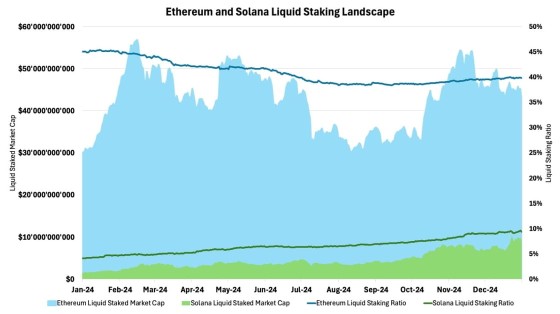
Source: 21Shares, Dune
Ethereum’s Lido offers users only native yield, excluding MEV, while most of its network activity has shifted to its L2 vertical. In contrast, Solana’s ecosystem provides more comprehensive yield opportunities. Recent data illustrates this divergence: Ethereum saw a net outflow of nearly $500M, while Solana attracted a substantial $2.7B net inflow, highlighting the growing appeal of Solana’s more integrated yield structure.
Figure 10: Total Net Flows Across Ecosystems
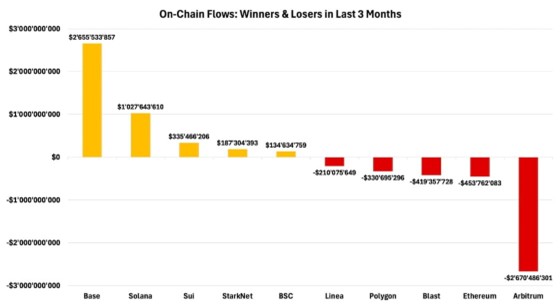
Source: 21Shares, Artemis
Decentralized Exchanges (DEXs)
As highlighted earlier, while the capital deposited into DEXs contributes a larger share on Ethereum, Solana’s DEX volume majorly outpaces the latter due to its cost efficiency and high transaction throughput, as seen in Figure 11. What’s more impressive is that Solana actually outpaced Coinbase’s monthly volume in January while making up close to half of Nasdaq’s volume.
Figure 11: DEX Volume on Solana vs Ethereum and Others
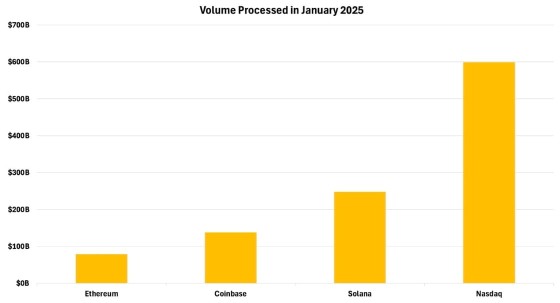
Source: 21Shares, Artemis, Coingecko, Nasdaq
Emerging Industries
Overall, Solana has successfully captured both user interest and capital, as demonstrated throughout the report. This shift can be attributed to the network’s improved sustainability and its resolution of past downtime issues, which had previously hindered broader adoption. Solana’s enhanced reliability, coupled with its scalable architecture, has also positioned it as the go-to platform for emerging industries. A notable example is Decentralized Physical Infrastructure (DePIN), where 7 of the top 10 applications by active nodes are now operating on Solana, as shown below.
Figure 12: Landscape of DePIN Applications
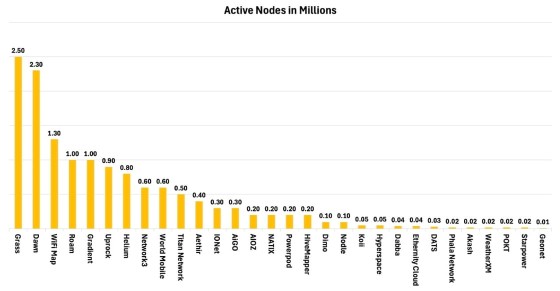
Source: 21Shares, Messari
Solana has captured over 50% of the blockchain-based AI agent sector, which has surged in prominence over the past 9 months. This dominance stems from the same factors that made Solana ideal for DePIN: its high-performance, cost-effective architecture that enables microtransactions and reduces operational costs. Additionally, Solana boasts a thriving AI ecosystem featuring key service providers like Render and IO.NET alongside numerous distributed computing and AI-servicing applications. Consequently, Solana’s infrastructure has proven exceptionally suitable for AI agent operations, establishing it as the premier platform for this innovative domain.
Looking ahead, while decentralized AI training and inference are still emerging concepts, 2025 is expected to witness significant advancements in these areas. This progression is likely to further reinforce Solana’s status as the ecosystem of choice for AI experimentation and innovation within the industry, attracting more developers and capital to its expanding ecosystem. As a result, Solana has already emerged as the leading platform for attracting new developers, bypassing Ethereum for the first time ever, as shown below.
Figure 13: New Developer Interest by Blockchain
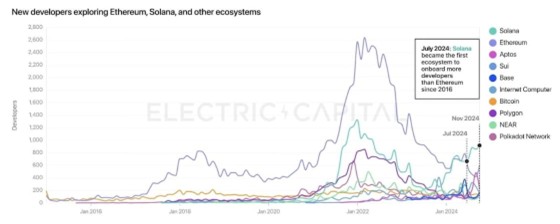
Source: ElectricCapital
Market Positioning
May that be, Ethereum has still solidified its position as the second-most institutionally accepted cryptoasset in the U.S., following Bitcoin’s lead in SEC-approved ETFs. Since their summer 2024 debut, Ethereum ETFs have attracted $2.26B in net inflows with a noticeable uptick in activity, as can be observed in Figure 14 below, which may suggest it is gaining more traction. However, In Europe, Solana has edged ahead, securing 13% market share ($2.6B AUM) versus Ethereum’s 12% ($2.5B AUM). This shift reflects Solana’s impressive trajectory, rebounding from the FTX setback to become a powerhouse in DeFi, DePIN, and AI innovation. As Solana awaits its potential U.S. ETF approval, its European performance suggests a similar course for success in the American market.
Figure 14: U.S. Spot Ethereum ETF Net Inflows

Source: 21Shares, Glassnode
All in all, Solana’s remarkable ascent over the past year has been propelled by a series of high-profile partnerships, solidifying its position in the blockchain landscape. The network’s integration with Shopify has unlocked crypto payment capabilities for millions of businesses, while collaborations with financial giants have brought institutional credibility:
• Franklin Templeton, which manages trillions in assets, plans to launch a mutual fund on Solana.
• Hamilton Lane, which oversees $900B, introduced the first institutional-grade private credit fund on the network.
• PayPal launched PYUSD and is leveraging Solana for stablecoin transactions, already driving nearly $30B in volume.
• Stripe adopted Solana for streamlining cross-border transactions, capitalizing on its high throughput and minimal fees.
• Visa successfully utilized Solana for cross-border USDC transfers.
• Citibank and Société Générale explored tokenized deposits and bond tokenization, respectively.
Solana’s appeal extends beyond finance, with ongoing UI/UX developments like Solana Blinks enabling seamless payments through social media networks. The introduction of Solana’s handheld devices, such as Solana Seeker, further simplifies user onboarding, making blockchain technology more accessible than ever. These strategic moves and innovations have collectively reinforced Solana’s standing as an efficient, and user-friendly blockchain poised for growth.
While Solana is making significant strides in tokenization and payments, Ethereum remains a formidable force, particularly in the tokenization space. The network’s focus on decentralization has positioned it as ”Wall Street’s Chain,” attracting TradFi giants like BlackRock and UBS. These institutions leverage Ethereum’s robust security infrastructure for tokenization, viewing its higher transaction costs as a worthwhile trade-off for unparalleled trust and reliability. Further, Ethereum dominates this sector, with $3.8B in tokenized assets (excluding stablecoins), accounting for over 80% of the market, as shown below.
Figure 15: Tokenization Market Cap by Blockchain
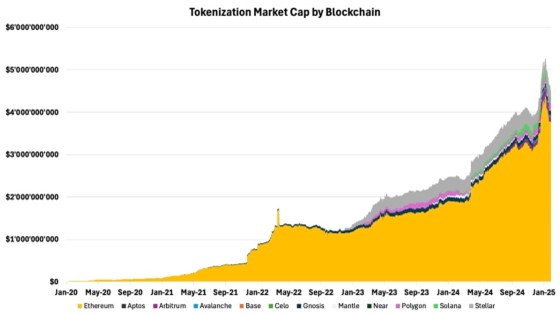
Source: 21Shares, Dune
Its security, robust DeFi ecosystem, and first-mover advantage also make it the leader in fiat-collateralized stablecoins, boasting $115B in tokenized assets, which serve as a proxy for financial liquidity. Moreover, thanks to its first mover advantage, Ethereum boasts unparalleled network effects, underpinning its dominance in DeFi, a sector we expect to see significant growth under the new administration, further evidenced by World Liberty Financial’s recent acquisitions of ETH, which have cumulatively added up to $200M so far.
As seen, it’s far from doom and gloom for Ethereum, as the network actively addresses key challenges to maintain its dominance. One pressing issue is the reduced revenue from L2s following the Dencun upgrade, which significantly lowered mainnet data posting costs. However, Ethereum’s economic sustainability could rebound as demand for blob space intensifies, potentially surpassing 100% of its target capacity this year. The network is also exploring revenue-sharing agreements with L2s to redirect value back to the mainnet and considering raising minimum blob fees to boost revenue from these types of transactions. Importantly, the reduced gas fees have made Ethereum more attractive to developers and users, fostering long-term growth and adoption—exemplified by Base’s rapid expansion. As shown in Figure 16, weekly active addresses on L2s hit an all-time high of 10.18M in 2025, this surge in adoption is expected to channel even greater activity back to Ethereum’s mainnet, reinforcing its formidable position.
Figure 16: Ethereum L2s Weekly Addresses
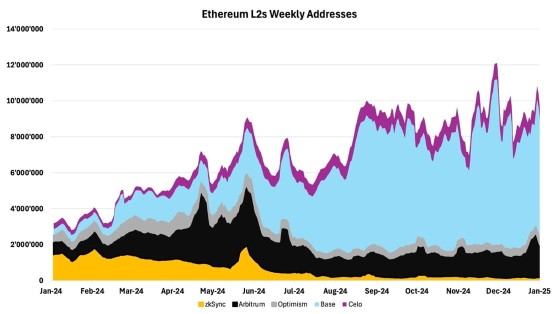
Source: 21Shares, TokenTerminal
Conclusions: Key Upgrades and Competitive Landscape
• Ethereum’s Pectra upgrade enhances staking efficiency and introduces Account Abstraction (AA), enabling gas sponsorship and payments in various tokens (with auto-conversion to ETH) to simplify user interactions.
• Solana’s Firedancer upgrade targets over 1 million TPS through modular design and a third validator client, improving scalability and reducing single-point-of-failure risks.
• Competitive positioning: Solana dominates high-speed, low-cost sectors (AI/DePIN), while Ethereum leads in tokenization/DeFi via institutional trust and network effects.
• Industry outlook: Both chains coexist by specializing – Solana in high-throughput innovation and Ethereum in ecosystem depth and institutional adoption.
Given the future of crypto’s multichain trajectory, both networks will coexist while competing asymmetrically. Our analysis suggests Solana is positioned to capture greater market share (as detailed in our 2025 Market Outlook), evidenced by its recent flip of Ethereum’s price-to-sales ratio, as shown below in Figure 17. This shift reflects Solana’s dominance in high-activity sectors like memecoins and AI agents, where its architecture enables cost-efficient innovation. While Solana currently presents a stronger valuation, both chains maintain distinct roles – Ethereum for institutional-grade finance and tokenization and Solana for scalable consumer applications – making them complementary holdings for strategic diversification.
Figure 17: Ethereum vs. Solana Price-to-Sales Ratio
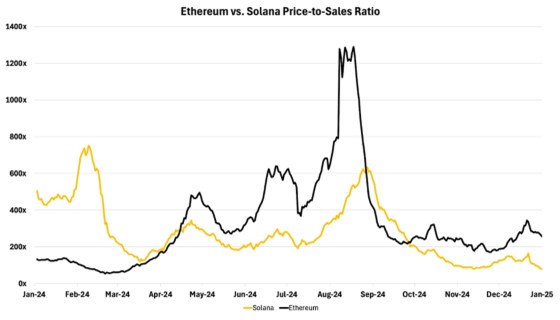
Source: 21Shares, Token Terminal
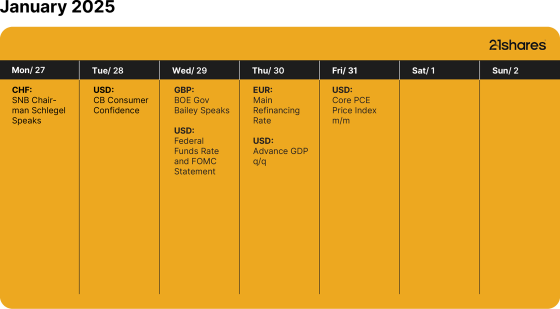
What’s happening this week?
Research Newsletter
Each week the 21Shares Research team will publish our data-driven insights into the crypto asset world through this newsletter. Please direct any comments, questions, and words of feedback to research@21shares.com
Disclaimer
The information provided does not constitute a prospectus or other offering material and does not contain or constitute an offer to sell or a solicitation of any offer to buy securities in any jurisdiction. Some of the information published herein may contain forward-looking statements. Readers are cautioned that any such forward-looking statements are not guarantees of future performance and involve risks and uncertainties and that actual results may differ materially from those in the forward-looking statements as a result of various factors. The information contained herein may not be considered as economic, legal, tax or other advice and users are cautioned to base investment decisions or other decisions solely on the content hereof.


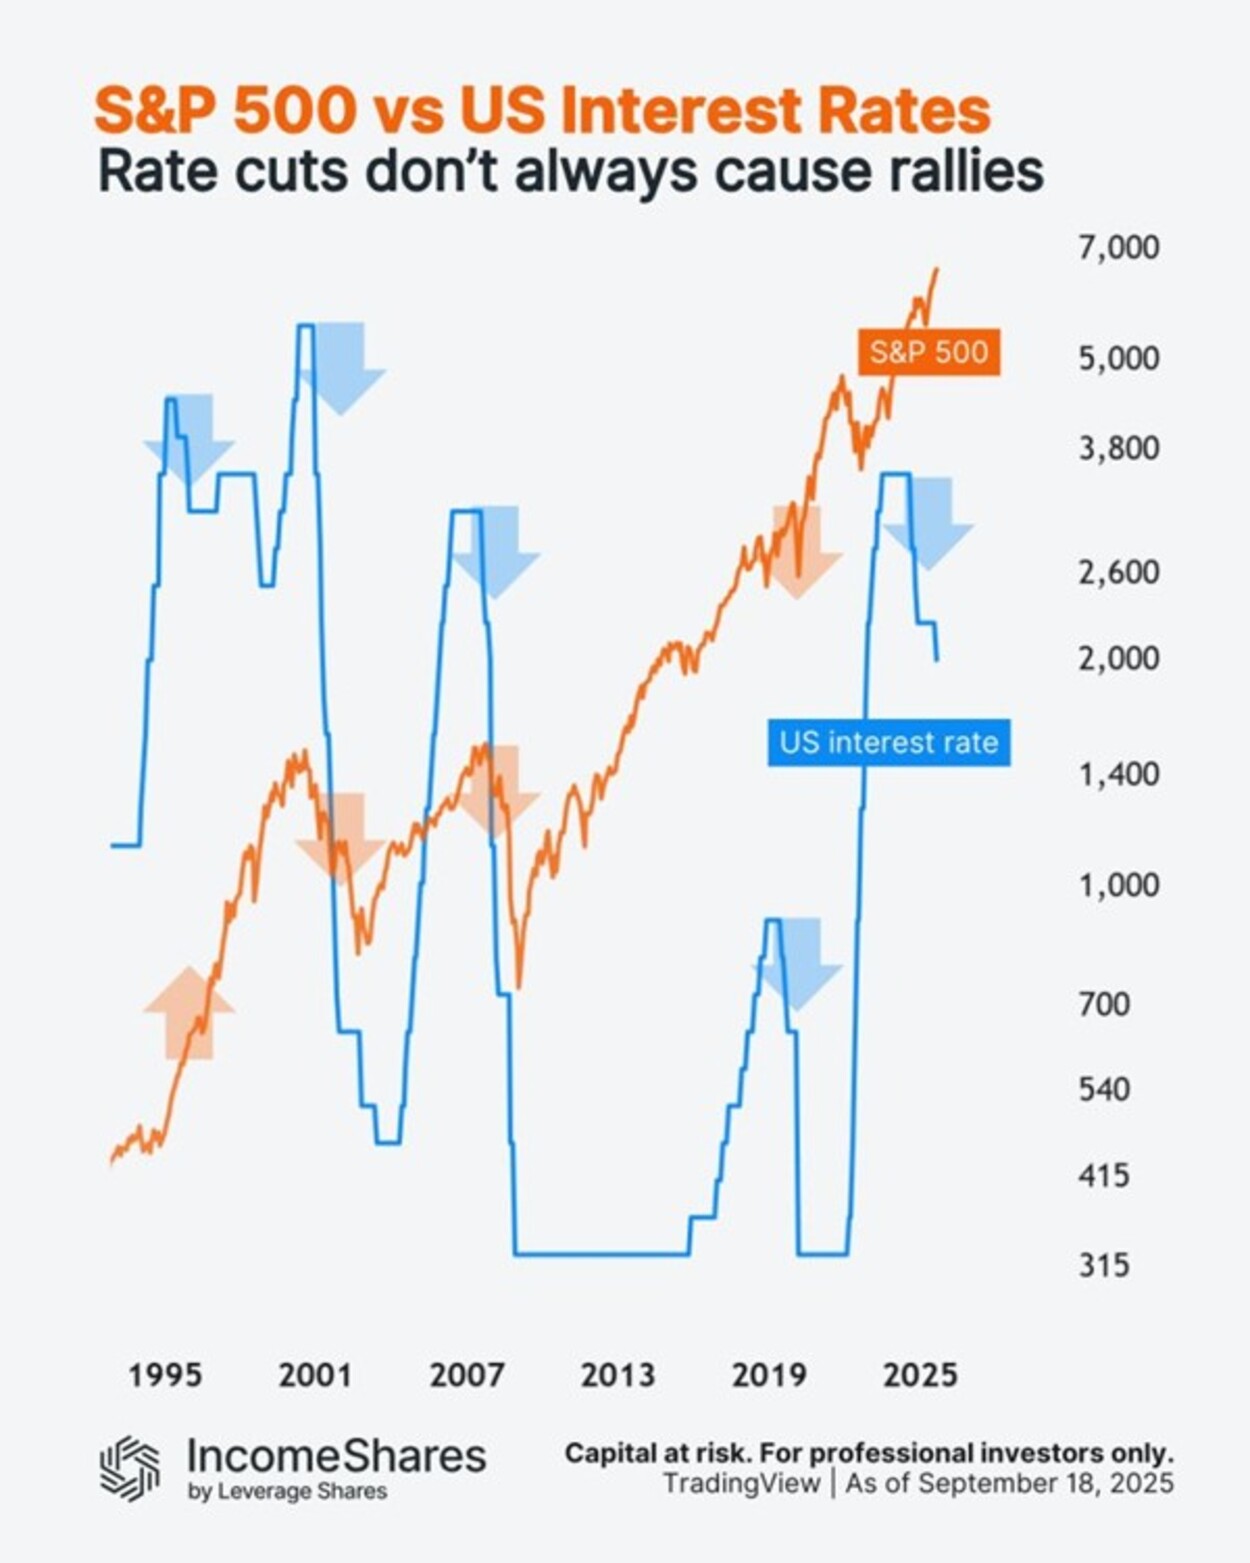
Den amerikanska centralbanken Federal Reserve sänkte räntorna med 0,25 % i veckan– men vad kan det betyda för den amerikanska aktiemarknaden?
Detta diagram följer S&P 500-indexet (orange linje) mot amerikanska räntor (blå linje) sedan 1990-talet.
Här är vad som hände med aktierna de senaste gångerna Fed började sänka räntorna från tidigare ränte”toppar”:
• 1995: aktierna steg (före dotcom-bubblan).
• 2000: aktierna föll (dotcom-bubblan sprack).
• 2007: ytterligare en björnmarknad (före finanskrisen 2008).
• 2019: aktierna steg först (sedan föll de in i Covid-kraschen 2020).
Fyra av fem gånger sammanföll räntesänkningarna med stora nedgångar. Men orsakerna var alltid olika. Korrelation innebär inte kausalitet.
Och nu, 2024/25, befinner vi oss i en ny sänkningscykel. Aktierna sjönk med cirka 20 % i början av 2025, men har sedan dess stigit till nya toppar. Frågan är, vad händer härnäst?
IncomeShares S&P500 Options (0DTE) ETP har exponering mot S&P 500 och säljer dagliga säljoptioner för potentiell inkomst.
Följ IncomeShares EU för marknadsinsikter.


HANetfs VD kommenterar kärnkraftsavtalet mellan Storbritannien och USA

WMSE ETF en global momentumfond som handlas i euro och pund

Federal Reserve sänkte räntorna med 0,25 %

ARAY ETP följer priset på kryptovalutan Raydium

Bellevue lanserar aktiv hälso-ETF på Xetra

Utdelningar och försvarsfonder lockade i augusti

Månadsutdelande ETFer uppdaterad med IncomeShares produkter

HANetfs analyserar hur ett fredsavtal kan påverka det europeiska försvaret

ADLT ETF investerar bara i riktigt långa amerikanska statsobligationer

Septembers utdelning i XACT Norden Högutdelande
-
 Nyheter3 veckor sedan
Utdelningar och försvarsfonder lockade i augusti
-
 Nyheter4 veckor sedan
Månadsutdelande ETFer uppdaterad med IncomeShares produkter
-
 Nyheter4 veckor sedan
HANetfs analyserar hur ett fredsavtal kan påverka det europeiska försvaret
-
 Nyheter4 veckor sedan
ADLT ETF investerar bara i riktigt långa amerikanska statsobligationer
-
 Nyheter2 veckor sedan
Septembers utdelning i XACT Norden Högutdelande
-

 Nyheter4 veckor sedan
Fastställd utdelning i MONTDIV augusti 2025
-

 Nyheter2 veckor sedan
HANetf kommenterar mötet mellan Kina, Ryssland och Nordkorea vid militärparad
-

 Nyheter4 veckor sedan
AICT ETF investerar i obligationer utgivna av företag från tillväxtmarknader