
Nyheter
ETC Group Crypto Market Compass #6 2024
• Cryptoassets continued to recover despite a more hawkish guidance by the Fed
• Our in-house “Cryptoasset Sentiment Index” has stabilized and remains slightly bearish
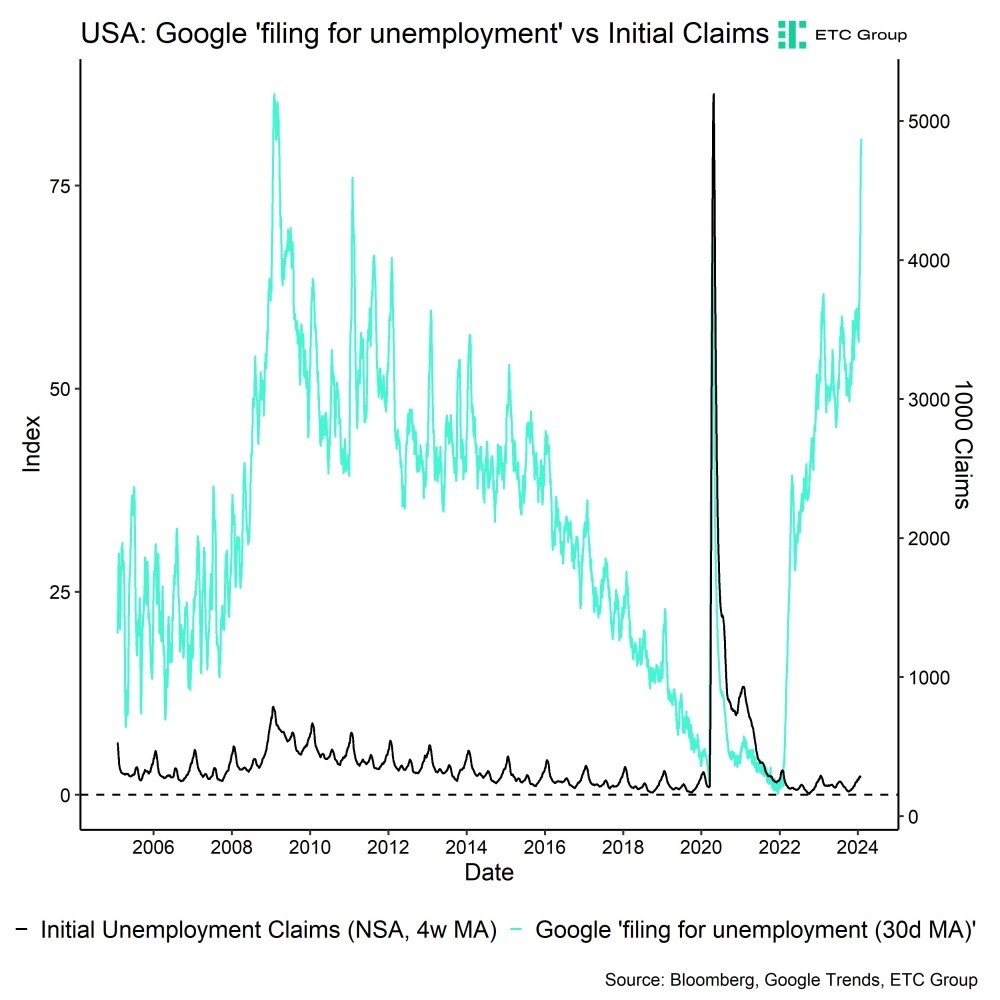
• Despite the supposedly strong non-farm payrolls report last Friday, we see increasing evidence of a weakening labour market in the US
Chart of the Week
Performance
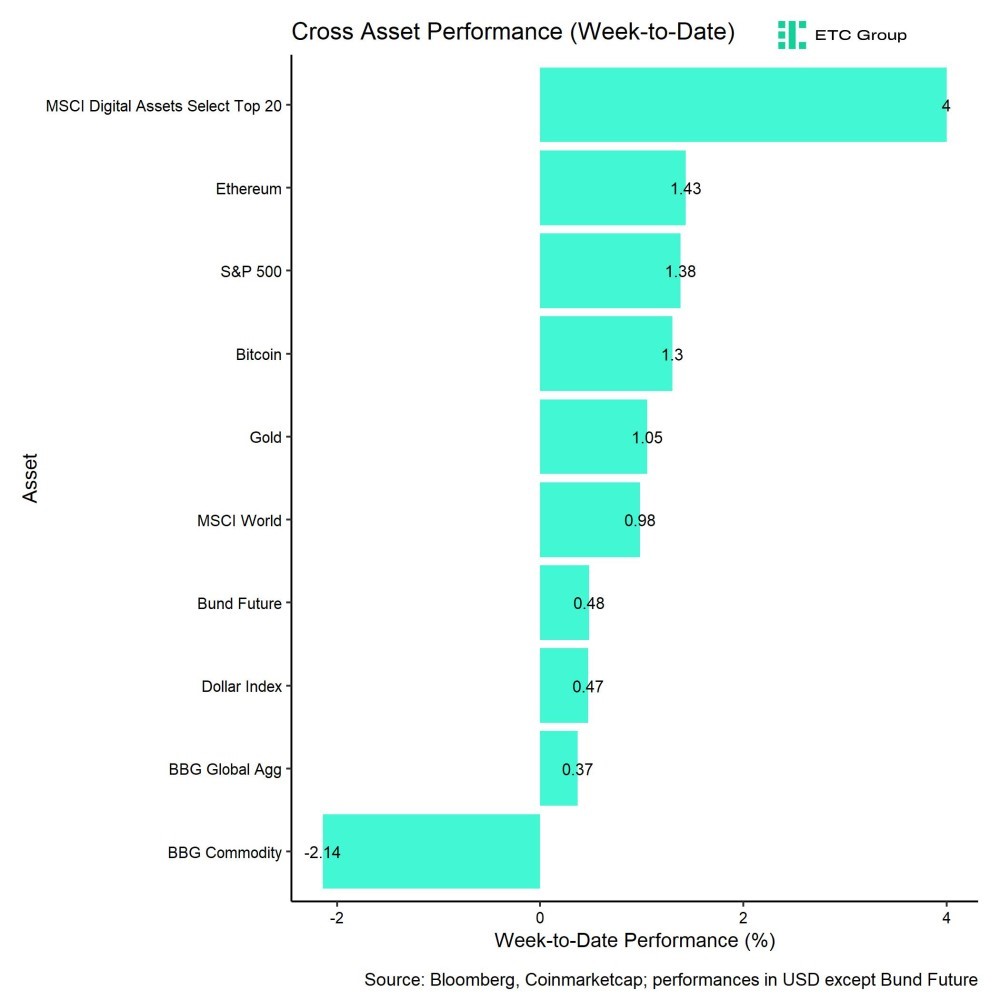
Last week, cryptoassets continued to recover on the back of positive net inflows into US spot Bitcoin ETFs and an improving cryptoasset sentiment.
Nonetheless, these positive developments were somewhat overshadowed by a more hawkish guidance by the Fed that guided markets towards later-than-expected interest rate cuts.
Before the FOMC meeting started on Tuesday last week, rates traders had expected the rate cutting cycle to commence in March, which was priced out to May 2024 after the FOMC meeting. This stance was somewhat confirmed with the latest non-farm payrolls jobs numbers on Friday that were significantly above consensus expectations, and which implied that the US labour market was still running hot.
This implied a “higher for longer” interest rate expectation which also led to a significant increase in long-term Treasury yields.
All of this happened during a week where another US regional bank’s stock price unexpectedly sold off on account of high loan loss provisions and dividend cuts due to its high US commercial real estate loan exposure. Systemic risks appear to be resurfacing after a Japanese bank with significant US commercial real estate exposure also unexpectedly sold off last week.
A “higher for longer” stance of monetary policy by the Fed appears to induce renewed weakness in the (regional) banking system which is why we expect that the Fed will most-likely not be able to prolong its current pause in the interest rate cycle for much longer before commencing the rate cutting cycle.
Moreover, although the latest jobs report appears to confirm the Fed’s more hawkish stance at first sight, a view beneath the strong headline numbers reveals that most of the job gains were related to increases in multiple job holders and part-time workers. In addition, leading labour market indicators such as average hours worked have declined to levels last seen during the Covid recession.
So, while overall payrolls are increasing, it appears as if companies are reluctant to increase full-time jobs as they are already reducing working hours. This is rather a sign of a weakening labour market.
What does that mean for Bitcoin and cryptoassets?
We still measure a significant dominance of global growth expectations for Bitcoin – around 55% of performance variations in the price of Bitcoin could be explained by changes in global growth expectations over the past 6 months.
However, that dominance has been gradually receding in favour of an increasing relevance of monetary policy and US Dollar changes which have accounted for 22% and 13%, respectively, in the variation in the price of Bitcoin over the past 6 months.
Based on these calculations, we expect that any weakness in global growth expectations due to a US recession could affect Bitcoin negatively at first but could also provide a tailwind as a second order effect due to a reversal in monetary policy expectations and a weaker US Dollar.
This would be similar to the performance patterns that we observed during the collapse of Silicon Valley Bank (SVB) in March 2023. We could see a revival of that since Bitcoin is one of the few counterparty risk-free assets and systemic risks in the traditional banking system could induce some kind of “flight-to-safety” into Bitcoin.
A reversal in monetary policy is most likely sparked by either a systemic weakness in the banking system or a significant increase in the unemployment rate over the coming months.
In our last report, we stated that we expected the influence of macro factors on Bitcoin & Cryptoassets to reassert itself over the coming weeks. This expectation already seems to materialize with the latest macro developments.
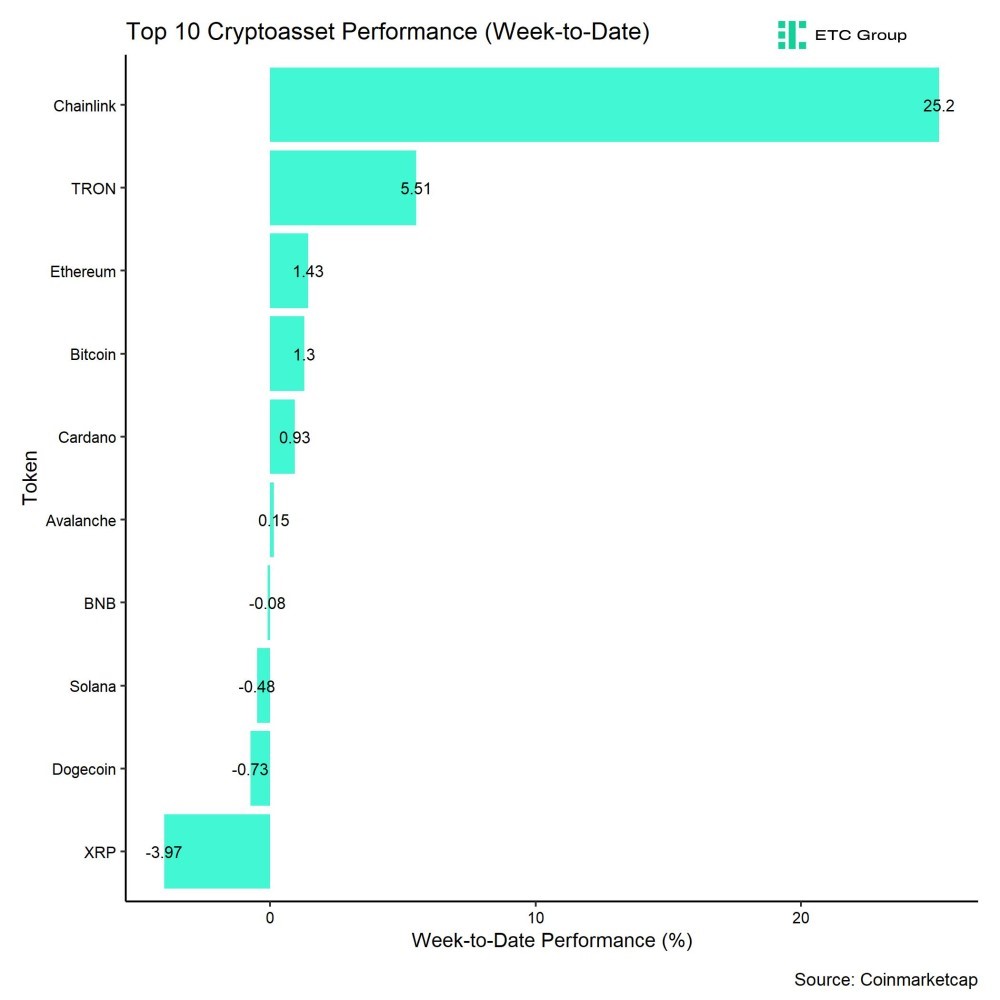
In general, among the top 10 crypto assets, Chainlink, TRON, and Ethereum were the relative outperformers.
Chainlink’s recent partnership with China’s national Blockchain Services Network, which utilizes Chainlink’s oracle network, has likely boosted investor confidence and contributed to the recent price increase.
Nonetheless, altcoin outperformance vis-à-vis Bitcoin was relatively weak, with only 25% of our tracked altcoins managing to outperform Bitcoin on a weekly basis.
Sentiment
Our in-house “Cryptoasset Sentiment Index” has stabilized and remains slightly bearish.
At the moment, only 5 out of 15 indicators are above their short-term trend.
Compared to last week, we saw major reversals to the upside in BTC exchange inflows and the crypto dispersion index. The former implies lower exchange in flows which tends to be bullish and the latter implies increasing performance dispersion among cryptoassets which also tends to be a positive signal.
The Crypto Fear & Greed Index remains in ”Greed” territory as of this morning.
Meanwhile, our own measure of Cross Asset Risk Appetite (CARA) has recently increased as well albeit from lower levels. Overall, this is signalling a rather neutral sentiment in traditional financial markets.
As mentioned before, performance dispersion among cryptoassets has remained relatively high.
In general, high-performance dispersion among cryptoassets implies that correlations among cryptoassets have decreased, which means that cryptoassets are trading more on coin-specific factors and that diversification among cryptoassets is high.
At the same time, altcoin outperformance vis-à-vis Bitcoin was still relatively low, with no clear outperformance of Ethereum vis-à-vis Bitcoin. Viewed more broadly, only 25% of our tracked altcoins have outperformed Bitcoin on a weekly basis.
In general, low altcoin outperformance tends to be a sign of low risk appetite within cryptoasset markets.
Fund Flows
Overall, we saw net fund inflows in the amount of +698.9 mn USD (week ending Friday) based on Bloomberg data across all types of cryptoassets.
Global Bitcoin ETPs saw a reversal compared to last week with significant net inflows of +697.3 mn USD of which +819 mn (net) were related to US spot Bitcoin ETFs alone.
The Grayscale Bitcoin Trust (GBTC) continued to see net outflows of around -927 mn USD last week. This was more than offset by net inflows into other US spot Bitcoin ETFs that were able to attract +1,746 mn USD in net inflows. BlackRock’s iShares Bitcoin Trust (IBIT) took in +883 mn USD last week and surpassed 3 bn USD in AuM.
On a positive note, the outflows from GBTC continued to slow down over the past 5 trading days and last Friday saw the lowest daily net outflow since trading launch on the 11/01.
Note that some fund flows data for US major issuers are still lacking in the abovementioned numbers due to T+2 settlement.
Apart from Bitcoin, we saw comparatively small flows into other cryptoassets last week.
Outflows from global Ethereum ETPs of around -22.2 mn USD were somewhat offset by inflows into other altcoin ETPs ex Ethereum that managed to attract +23.6 mn USD last week.
Thematic & basket crypto ETPs were more or less unchanged, with only +0.2 mn USD in net inflows, based on our calculations.
Besides, the beta of global crypto hedge funds to Bitcoin over the last 20 trading still remains low at below 0.8, implying that global crypto hedge funds still remain under-exposed to Bitcoin market risks. It appears as if crypto hedge funds are still waiting on the sidelines for new catalysts.
On-Chain Data
Core on-chain for Bitcoin remain somewhat mixed. For instance, active addresses as well as new addresses remain relatively low and also the number of addresses with non-zero balances has come off the recent highs. The same is true for the number of transactions on the core Bitcoin blockchain.
This happens amid a still relatively high count of inscriptions on the Bitcoin blockchain, implying that “pure” monetary transactions have been decreasing recently. The transaction count share of inscriptions had just recently reached an all-time high of 72% on the 28/01.
The share of inscriptions has reached around 61% this week as well. So, the share of inscriptions in Bitcoin transactions remains relatively high which is frequently a subject of discussion among the Bitcoin community. That being said, median transactions fees have declined significantly from their recent high from mid-December 2023 as have the share of fees in total BTC miner revenue which was between 5% and 15% last week.
Nonetheless, BTC miners continued to sell into their reserves last week which exerts some downward pressure on prices. Aggregate BTC miner reserves have reached the lowest level since July 2021.
However, in the grand scheme of overall exchange inflows, these exchange inflows are still comparatively small. Overall, exchange inflows remain very much dominated by ETF flows and whale deposits to exchanges (especially to Coinbase exchange).
All in all, net exchange transfers and deposits have recently been negative and BTC exchange balances have declined over the past week as a result. This implies overall increasing demand for Bitcoin. However, aggregate exchange balances have not reclaimed their multiyear lows yet.
In contrast, Ethereum exchange balances continue to drift lower and make fresh multiyear lows on a daily basis. This should provide a tailwind for the relative performance of Ethereum vis-à-vis Bitcoin.
Futures, Options & Perpetuals
BTC futures open interest declined somewhat last week while perpetual open interest moved sideways. There were no significant futures long or short liquidations compared to the week prior.
The 3-months annualized BTC futures basis declined somewhat to around 9.4% p.a. but BTC perpetual funding rates remained positive throughout the week across major derivatives exchanges.
BTC options’ open interest also remained relatively stable last week. Put-call open interest remains relatively low implying that most option traders are still engaged in calls and have a long bias. Put-call volume ratios also remained relatively low compared to the prior week implying that downside hedging activity has clearly levelled off.
That being said, BTC option traders have recently started to bid up the skew in favour of put options, implying renewed interest for downside hedges. At the time of writing delta-equivalent 1-month BTC put options have a 2%-points higher implied volatility than call options.
However, the declining trend in implied volatilities since early January 2024 also continued last week. At the time of writing, BTC ATM option implied volatility for 1-month options is around 39.6% which is significantly lower than the high of 71% reached on 07/01/2024.
Bottom Line
• Cryptoassets continued to recover despite a more hawkish guidance by the Fed
• Our in-house “Cryptoasset Sentiment Index” has stabilized and remains slightly bearish
• Despite the supposedly strong non-farm payrolls report last Friday, we see increasing evidence of a weakening labour market in the US
GENERAL DISCLAIMER
The information provided in this advertising material is for informative purposes only and does not constitute investment advice, a recommendation or solicitation to conclude a transaction.
This document (which may be in the form of a press release, social media post, blog post, broadcast communication or similar instrument – we refer to this category of communications generally as a “document” for purposes of this disclaimer) is issued by ETC Issuance GmbH (the “issuer”), a limited company incorporated under the laws of the Germany. This document has been prepared in accordance with applicable laws and regulations (including those relating to financial promotions). If you are considering investing in any securities issued by ETC Group, including any securities described in this document, you should check with your broker or bank that securities issued by ETC Group are available in your jurisdiction and suitable for your investment profile.
Exchange-traded commodities/cryptocurrencies, or ETCs, are a highly volatile asset and performance is unpredictable. Past performance is not a reliable indicator of future performance. The market price of ETCs will vary and they do not offer a fixed income. The value of any investment in ETCs may be affected by exchange rate and underlying price movements. This document may contain forward looking statements including statements regarding ETC Group’s belief or current expectations with regards to the performance of certain asset classes. Forward looking statements are subject to certain risks, uncertainties and assumptions, and there can be no assurance that such statements will be accurate and actual results could differ materially. Therefore, you must not place undue reliance on forward-looking statements.
This document does not constitute investment advice nor an offer for sale nor a solicitation of an offer to buy any product or make any investment. An investment in an ETC that is linked to cryptocurrency, such as those offered by ETC Group, is dependent on the performance of the underlying cryptocurrency, less costs, but it is not expected to match that performance precisely. ETCs involve numerous risks including among others, general market risks relating to underlying adverse price movements and currency, liquidity, operational, legal and regulatory risks.
ETC Issuance GmbH, incorporated under the laws of Germany, is the issuer of any securities described in this document, under the base prospectus dated 23 November 2021, and previously the the base prospectus dated 14th January 2021 and prospectus dated 4 June 2020,, and various sets of final terms (in relation to BTCE, ZETH and other series of securities issued under that base prospectus), in each case as supplemented from time to time, and approved by BaFin. Any decision to invest in securities offered by ETC Group (including products and amounts) should take into consideration your specific circumstances after seeking independent investment, tax and legal advice. You should also read the latest version of the prospectus and/or base prospectus before investing and in particular, refer to the section entitled ‘Risk Factors’ for further details of risks associated with an investment. These prospectuses and other documents are available under the “Resources” section at etc-group.com. When visiting this website, you will need to self-certify as to your jurisdiction and investor type in order to access these documents, and in so doing you may be subject to other disclaimers and important information.
IF YOU ARE IN THE UK, US, OR CANADA
Information contained in this document is not, and under no circumstances is to be construed as, an advertisement or any other step in furtherance of a public offering in the United States or Canada, or any state, province or territory thereof, where neither the issuer nor its products are authorised or registered for distribution or sale and where no prospectus of the issuer has been filed with any securities regulator. Neither this document nor information in it should be taken, transmitted or distributed (directly or indirectly) into the United States.
PUBLICATIONS & SOCIAL MEDIA DISCLOSURE
Social media posts (including, but not limited to, LinkedIn and Twitter) of ETC Group and its subsidiaries (“Social Media”) are not, and should not be considered to be recommendations, solicitations or offers by ETC Group or its affiliates to buy or sell any securities, futures, options or other financial instruments or other assets or provide any investment advice or service. ETC Group makes all reasonable efforts to ensure that the information contained on Social Media is accurate and reliable; however, errors sometimes occur. You should note that the materials on Social Media are provided “as is” without any express or implied warranties. ETC Group does not warrant or represent that the materials on Social Media are accurate, valid, timely or complete.
RISKS OF CRYPTOCURRENCIES
Cryptocurrencies are highly volatile assets and are known for their extreme fluctuations in prices. While there is potential for significant gains, you are at risk of losing parts or your entire capital invested. The value of the ETCs is affected by the price of its underlying cryptocurrency. The price of cryptocurrencies can fluctuate widely and, for example, may be impacted by global and regional political, economic or financial events, regulatory events or statements by regulators, investment trading, hedging or other activities by a wide range of market participants, forks in underlying protocols, disruptions to the infrastructure or means by which crypto assets are produced, distributed, stored and traded. The price of cryptocurrencies may also change due to shifting investor confidence in future outlook of the asset class. Characteristics of cryptocurrencies and divergence of applicable regulatory standards create the potential for market abuse and could lead to high price volatility. Amounts received by Bondholders (i) upon redemption of the Bonds in USD, in cases where Bondholders are prevented from receiving cryptocurrency for legal or regulatory reasons; or (ii) upon sale on the stock exchange depend on the price performance of the relevant cryptocurrency and available liquidity.
For a detailed overview of risks associated with cryptocurrencies and specifically associated with the ETCs, please refer to the prospectus and base prospectus available at the issuer’s website at www.etc-group.com.


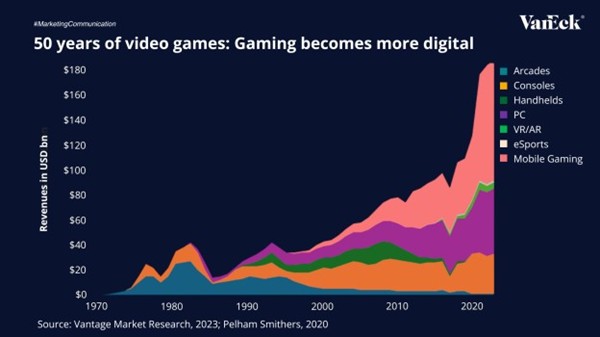
The global gaming industry has evolved into one of the world’s most dynamic entertainment sectors, expected to generate $188.9 billion in 2024 and surpass $200 billion by 2027, outpacing film and music combined.
From arcades to smartphones, the gaming industry has continuously evolved with each technological shift. Today, mobile gaming is a major player the market, currently accounting for the largest share of global revenues. As digital platforms, cloud gaming, and eSports continue to grow, gaming is establishing itself as a core part of the global entertainment economy.
Mobile gaming is leading this transformation, currently accounting for the majority of industry revenues and 40% of all global app downloads. With 5G adoption and 90% smartphone penetration expected by 2030, billions of new players will join the market, making gaming more accessible than ever.
However, the rollout of 5G also carries risks, uneven global infrastructure buildout, high capital costs for carriers, and potential fragmentation across networks could delay or limit the full realization of these benefits.
Source: Vantage Market Research, 2023; Pelham Smithers, 2020
To receive more Gold Investing insights, sign up to our newsletter.
IMPORTANT INFORMATION
This is marketing communication. Please refer to the prospectus of the UCITS and to the KID/KIID before making any final investment decisions. These documents are available in English and the KIDs/KIIDs in local languages and can be obtained free of charge at www.vaneck.com, from VanEck Asset Management B.V. (the “Management Company”) or, where applicable, from the relevant appointed facility agent for your country.


Is Mobile Powering the Future of Gaming?

Fyra nya börshandlade fonder från JP Morgan

AIFS ETF en satsning på infrastruktur för artificiell intelligens

J.P. Morgan Asset Management utökar sitt erbjudande med två nya aktiva ETFer

ISRU ETF köper aktier i stora amerikanska företag

HANetf och Infrastructure Capital Advisors samarbetar för att lansera aktivt förvaltad preferensavkastnings-ETF i Europa

De bästa lågvolatilitets ETFer på marknaden
Time in Bitcoin beats timing Bitcoin

HANetf kommenterar kopparuppgången

Fokus mot en helt ny börshandlad produkt i september 2025
-
 Nyheter4 veckor sedan
HANetf och Infrastructure Capital Advisors samarbetar för att lansera aktivt förvaltad preferensavkastnings-ETF i Europa
-
 Nyheter4 veckor sedan
De bästa lågvolatilitets ETFer på marknaden
-

 Nyheter4 veckor sedan
Time in Bitcoin beats timing Bitcoin
-
 Nyheter4 veckor sedan
HANetf kommenterar kopparuppgången
-
 Nyheter2 veckor sedan
Fokus mot en helt ny börshandlad produkt i september 2025
-

 Nyheter3 veckor sedan
M5TYs senaste utdelningstakt (55 %) belyser covered call-strategins inkomstpotential
-

 Nyheter3 veckor sedan
Börshandlade fonder för europeiska small caps
-

 Nyheter3 veckor sedan
Could Bitcoin be the key to your dream house?