
Nyheter
Crypto Market Compass 24 June 2024
• Last week, cryptoassets underperformed again as global crypto ETP flows experienced the 2nd highest weekly net outflows on record
• Our in-house “Cryptoasset Sentiment Indicator” has decreased and signals a slightly bearish sentiment
• Despite increasing bearishness in crypto markets, BTC options still imply an elevated level of complacency among crypto investors; an increase in risk aversion in BTC options could signal a more sustainable tactical bottom
Chart of the Week
Performance
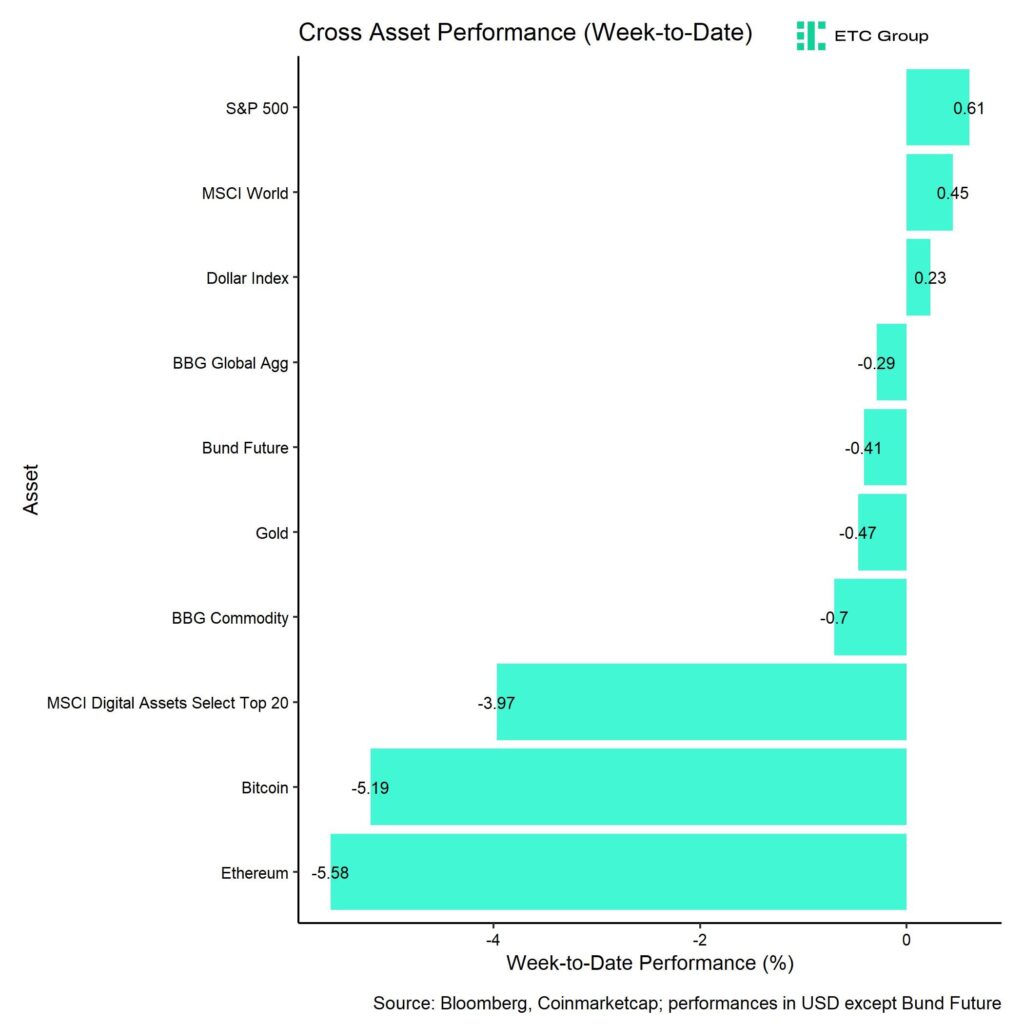
Last week, cryptoassets underperformed traditional assets like equities and bonds as global crypto ETP flows experienced the 2nd highest weekly net outflows on record.
We have recently highlighted the increasing macro risks that could be one of the reasons for the increasing risk aversion in crypto markets.
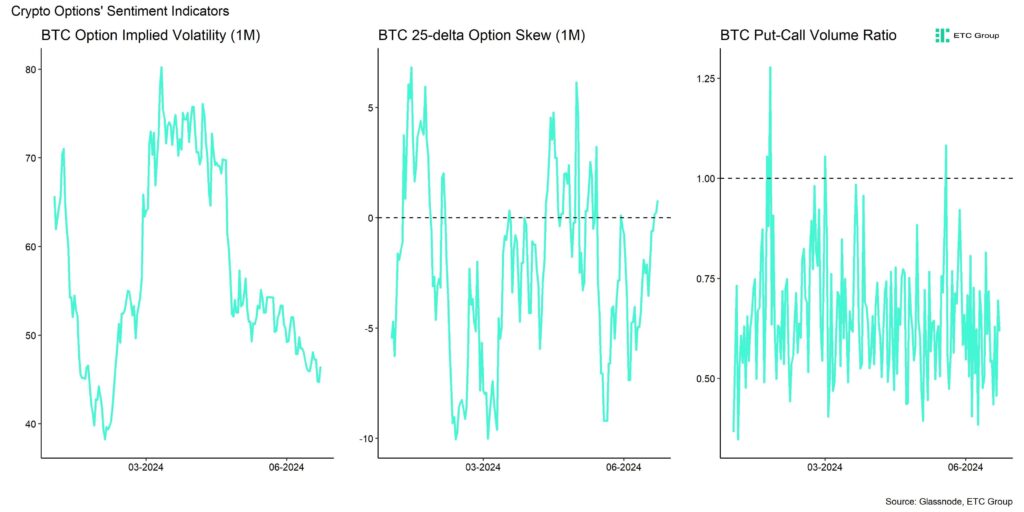
That being said, although Cryptoasset Sentiment has indeed declined, there are still some “pockets” of complacency visible. Most importantly, BTC options still only signal a slight increase in risk aversion as implied volatilities and put-call volume ratios continue to be relatively low (Chart-of-the-Week).
BTC option indicators are one of the market segments we are watching to assess a more sustainable tactical bottom in Bitcoin and cryptoassets more broadly.
Meanwhile, major US equity indices continued to rallye to new all-time highs despite declining market breadth and deteriorating macro fundamentals.
In the context of macro fundamentals, the decline in lumber prices is particularly concerning as lumber prices are regarded as one of the high-frequency leading indicators for the US housing market and the overall US economy.
The continued decline in lumber prices implies that US housing data like building permits and pending home sales will likely continue to surprise to the downside.
Since these indicators are long leading indicators for the US economy as well, we think that US recession risks continue to increase significantly.
The reason why this is relevant for cryptoasset investors is the fact that changes in global growth expectations continue to be the dominant macro factor for Bitcoin’s performance and correlations between the S&P 500 and major cryptoassets like
Bitcoin and Ethereum continue to be relatively high at around ~0.4 over the past 3 months.
This implies that any kind of US equity market correction (on account of rising US recession risks) would most likely affect Bitcoin and cryptoassets negatively in the short term.
It is important to note that the positive news flow as so far failed to reverse global crypto ETP flows in general and Bitcoin ETF flows in the US in particular. For instance, we have seen increasing bullish news flow on the corporate adoption side for Bitcoin this week.
Microstrategy (MSTR) has announced that it has purchased additional 11,931 BTC for ~786 mn USD last week. Besides, a cryptic tweet by Dell’s founder Michael Dell has fuelled speculation that Dell – the company or the person – might already be acquiring bitcoins.
Because Cryptoasset Sentiment and global crypto ETP flows tend to be highly correlated with cross asset risk appetite, we expect that these two variables continue to stay weak until risk appetite returns to markets more broadly.
We reiterate our stance that we continue to believe that the recent decline is an intermediate correction in the bull market and not a cyclical peak.
For this reason, our advice is to use any macro weakness as an opportunity to increase exposure ahead of major events in the coming months.
One of the main reasons for this is that, as we mentioned in one of our Crypto Market Espresso reports, we continue to expect the bitcoin halving to have a positive impact on performance from the summer onwards.
Moreover, Bloomberg analysts expect US spot Ethereum ETFs to debut in early July already, earlier than expected, which could bring additional flows into cryptoassets again as outlined here. Big crypto investors like Pantera have already indicated to invest up to 100 mn USD into these new Ethereum products once they have been launched.
In addition, as recently noted here, monetary policy moves by the SNB, ECB, Bank of Canada suggest that the liquidity tide is already reversing, which will undoubtedly be a major tailwind for bitcoin and other cryptoassets in the medium to long term. A reversal in the Fed’s monetary policy is also highly plausible in the event of a likely US recession.
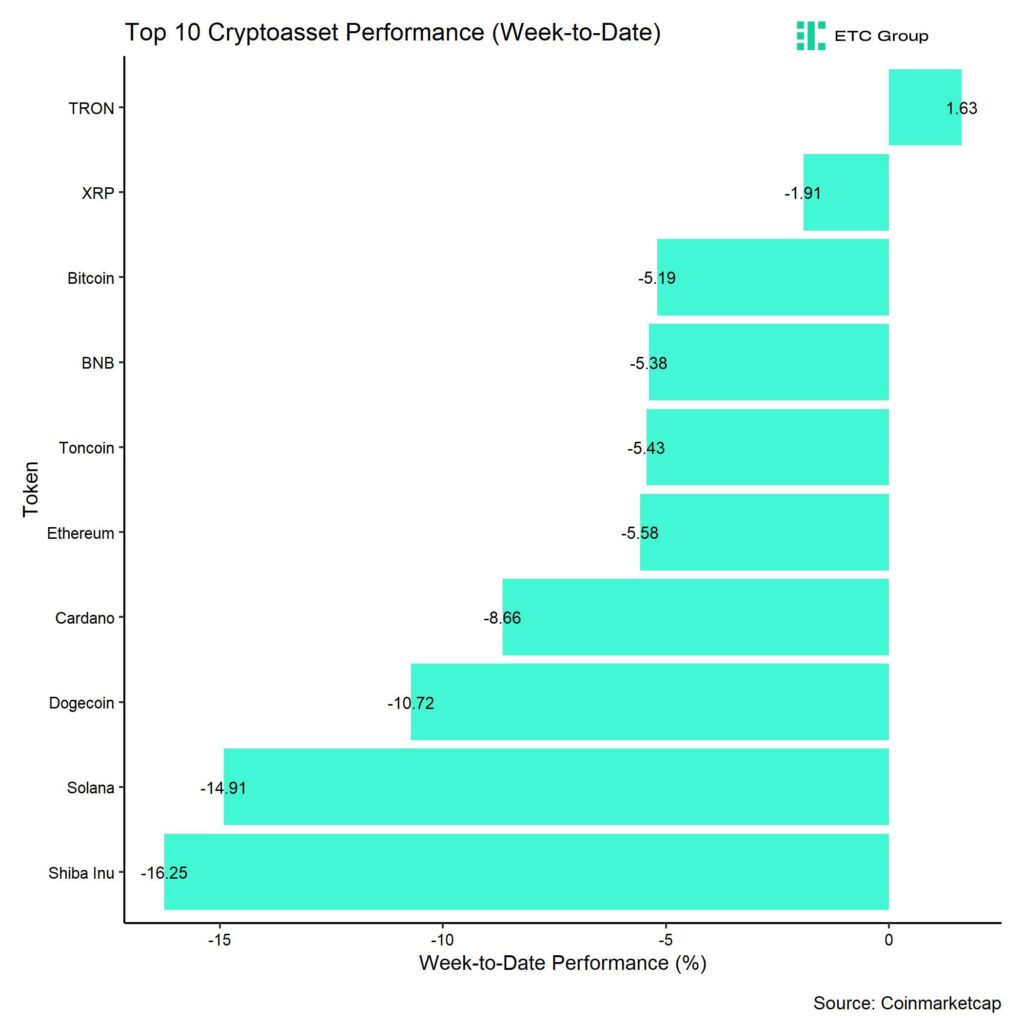
In general, among the top 10 crypto assets, TRON, XRP, and Bitcoin were the relative outperformers.
Overall, altcoin outperformance vis-à-vis Bitcoin has declined again compared to the prior week, with only 15% of our tracked altcoins managing to outperform Bitcoin on a weekly basis. This is consistent with the reversal in outperformance of Ethereum vis-à-vis Bitcoin on a weekly basis.
Sentiment
Our in-house “Cryptoasset Sentiment Index” has decreased and signals a slightly bearish sentiment.
At the moment, 4 out of 15 indicators are above their short-term trend.
Last week, there were significant reversals to the downside in the Crypto Fear & Greed Index and in the BTC long futures liquidation dominance.
The Crypto Fear & Greed Index signals ”Neutral” sentiment as of this morning.
Performance dispersion among cryptoassets has increased sharply from its recent lows. This means that altcoins have started to trade a bit differently than Bitcoin over the past week.
Altcoin outperformance vis-à-vis Bitcoin has declined again compared to the week prior, with around 15% of our tracked altcoins outperforming Bitcoin on a weekly basis, which is consistent with the fact that Ethereum underperformed Bitcoin slightly last week.
In general, increasing (decreasing) altcoin outperformance tends to be a sign of increasing (decreasing) risk appetite within cryptoasset markets and the latest altcoin underperformance could signal declining appetite for risk at the moment.
Sentiment in traditional financial markets has increased slightly but remains close to the lowest levels since November 2023, judging by our own measure of Cross Asset Risk Appetite (CARA).
Fund Flows
Last week, we saw significant net fund outflows from global crypto ETPs with around -745.3 mn USD in net outflows which was the second highest weekly net outflow on record.
Global Bitcoin ETPs saw net outflows of -739.0 mn USD last week, of which -544.1 mn USD (net) were related to US spot Bitcoin ETFs alone. Outflows from Hong Kong Bitcoin ETFs also picked up with -121.5 mn USD which contributed to the global rout as well.
The ETC Group Physical Bitcoin ETP (BTCE) saw increasing net outflows equivalent to -30.0 mn USD while the ETC Group Core Bitcoin ETP (BTC1) saw sticky AuM last week.
The Grayscale Bitcoin Trust (GBTC) saw less intense net outflows compared to the week prior but still recorded -152.6 mn USD in net outflows last week.
Meanwhile, net outflows from global Ethereum ETPs also accelerated last week with net outflows totalling -135.2 mn USD. This was partially due to accelerating outflows from Hong Kong Ethereum ETFs which recorded -68.9 mn USD in net
outflows.
However, the ETC Group Physical Ethereum ETP (ZETH) defied negative market trends and continued to see net inflows of +0.3 mn USD last week. The ETC Group Ethereum Staking ETP (ET32) also saw minor net inflows last week (+0.2 mn USD).
In contrast, altcoin ETPs ex Ethereum continued to experience net inflows of around +8.0 mn USD last week.
The same is true for Thematic & basket crypto ETPs which saw a very significant reversal in net inflows of +120.8 mn USD, based on our calculations. The ETC Group MSCI Digital Assets Select 20 ETP (DA20) saw neither in- nor outflows last week.
Meanwhile, global crypto hedge funds continued sail, the markets with an underweight exposure to Bitcoin. The beta of global crypto hedge funds’ performance stood at only 0.49 over the past 20 trading days.
On-Chain Data
Bitcoin on-chain continue to paint a rather bearish picture at the moment.
Net buying volumes on BTC spot exchanges continued to be negative, consistent with ongoing net outflows from global Bitcoin ETP and US spot Bitcoin ETFs. This is also evident in the widening negative Coinbase premium, which measures the price difference between Bitcoin prices on Coinbase and Binance. Since Coinbase tends to be dominated by larger investors, a negative premium to retail-dominated exchanges like Binance tends to be sign, of institutional selling. On a positive note, net selling pressure on exchanges seems to be declining gradually, measured by the cumulative volume delta.
Overall BTC exchange balances also increased over the past week on account of increasing whale exchange transfers. This has been holding up selling pressure on exchanges and is also consistent with the previous observations. Whales are defined as network entities that control at least 1,000 BTC. That being said, the absolute number of whales has stabilized last week, which is a positive sign.
However, OTC desk balances have surged significantly in a sign that institutional investors have transferred large amounts of bitcoin to OTC desks which also increases selling pressure. Some analysts have attributed this increase to increased transfers by BTC miners amid declining revenues post-Halving but aggregate BTC miner wallets continued to move sideways over the past 2 weeks which does not imply huge liquidations from miners.
Meanwhile, ETH exchange balances continue to drift lower and make fresh multi-year lows. Ethereum L2 metrics also continue to surprise to the upside with the number of weekly active users hitting a new all-time high last week.
Futures, Options & Perpetuals
Last week, both BTC futures and perpetuals open interest increased into declining prices, which implies that futures have been adding shorts on a net basis as long futures liquidations dominated.
In this context, the perpetual funding rate across BTC exchanges briefly turned negative last week Friday in a sign that positioning in perpetual futures is becoming lopsided which would be an approaching sign of an imminent tactical bottom.
However, perpetual funding rates have not turned negative in a way that would qualify to be a reliable signal.
The Bitcoin futures basis rate also continued to decline throughout the week. At the time of writing, the basis rate stands at 10.1% p.a. which is still like levels last seen in mid-May.
Although the signals in favour of a tactical floor are increasing, BTC options still only signal a slight increase in risk aversion as implied volatilities and put-call volume ratios continue to be relatively low (Chart-of-the-Week).
BTC option indicators are one of the market segments we are watching to assess a more sustainable tactical bottom in Bitcoin and cryptoassets more broadly.
Bitcoin options’ open interest increased slightly over the course of last week. Since the put-call open interest ratio remained flat during that time frame, this implies that option traders have both added calls and put options proportionally last week.
The 25-delta BTC 1-month option skew continued to drift higher but is still lower than the levels seen in May or April where we saw a short-term bottom.
BTC option implied volatilities were relatively unchanged last week. Implied volatilities of 1-month ATM Bitcoin options are currently at around 46.4% p.a.
Bottom Line
• Last week, cryptoassets underperformed again as global crypto ETP flows experienced the 2nd highest weekly net outflows on record
• Our in-house “Cryptoasset Sentiment Indicator” has decreased and signals a slightly bearish sentiment
• Despite increasing bearishness in crypto markets, BTC options still imply an elevated level of complacency among crypto investors; an increase in risk aversion in BTC options could signal a more sustainable tactical bottom
To read our Crypto Market Compass in full, please click the button below:

This is not investment advice. Capital at risk. Read the full disclaimer
© ETC Group 2019-2024 | All rights reserved


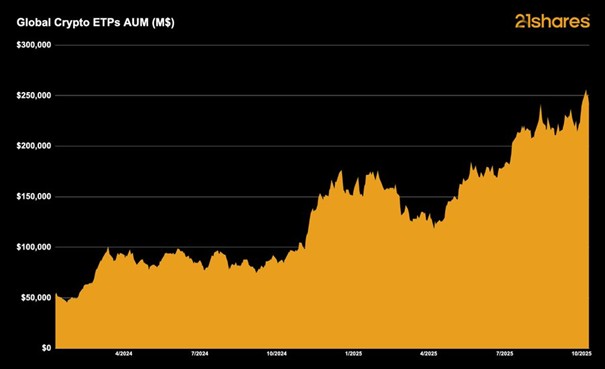
I början av året förutspådde 21shares att krypto-ETPer skulle driva ytterligare institutionell adoption och nå 250 miljarder dollar i förvaltat kapital globalt. Den milstolpen har just nåtts.
Research Newsletter
Each week the 21Shares Research team will publish our data-driven insights into the crypto asset world through this newsletter. Please direct any comments, questions, and words of feedback to research@21shares.com
Disclaimer
The information provided does not constitute a prospectus or other offering material and does not contain or constitute an offer to sell or a solicitation of any offer to buy securities in any jurisdiction. Some of the information published herein may contain forward-looking statements. Readers are cautioned that any such forward-looking statements are not guarantees of future performance and involve risks and uncertainties and that actual results may differ materially from those in the forward-looking statements as a result of various factors. The information contained herein may not be considered as economic, legal, tax or other advice and users are cautioned to base investment decisions or other decisions solely on the content hereof.


Globala krypto-ETPer förvaltade tillgångar når 250 miljarder dollar

YGLD ETP spårar priset på guld och ger en löpande avkastning

Investera i Stacks med en börshandlad produkt

VALOUR FLR SEK följer priset på kryptovalutan FLR
BlackRock utökar sitt utbud av iShares iBonds UCITS ETFer med sex nya lanseringar

HANetf och Infrastructure Capital Advisors samarbetar för att lansera aktivt förvaltad preferensavkastnings-ETF i Europa

IN0A ETF spårar S&P 500 med fokus på företag med höga ESG-betyg

De bästa lågvolatilitets ETFer på marknaden
PLTY ETP utfärdar optioner mot aktier i Palantir
Time in Bitcoin beats timing Bitcoin
-
 Nyheter4 veckor sedan
HANetf och Infrastructure Capital Advisors samarbetar för att lansera aktivt förvaltad preferensavkastnings-ETF i Europa
-
 Nyheter4 veckor sedan
IN0A ETF spårar S&P 500 med fokus på företag med höga ESG-betyg
-
 Nyheter3 veckor sedan
De bästa lågvolatilitets ETFer på marknaden
-

 Nyheter4 veckor sedan
PLTY ETP utfärdar optioner mot aktier i Palantir
-

 Nyheter4 veckor sedan
Time in Bitcoin beats timing Bitcoin
-

 Nyheter4 veckor sedan
HANetf kommenterar kopparuppgången
-

 Nyheter2 veckor sedan
Fokus mot en helt ny börshandlad produkt i september 2025
-

 Nyheter3 veckor sedan
M5TYs senaste utdelningstakt (55 %) belyser covered call-strategins inkomstpotential